CES: Printable & Archival Versions

By default, you are seeing this year's Corrections Environmental Scan. To see previous years' scans, simply enter the year (starting from 2017) that you would like to see, then click the Apply button.

It's also possible to filter the results by choosing options from the Perspective and Type dropdowns. Choosing these options will update the cover image to reflect the choice(s) that were made.

Print Advisory: The cover page background image may not print based on your browser's print settings defaulting to hide background colors and images. For best print results, we suggest using Chrome. The rest of the document will print as designed.

Print

Women's Risk Needs Assessment Research (WRNA)

The WRNA was originally created through a cooperative agreement between the National Institute of Corrections and the University of Cincinnati through research conducted by Patricia Van Voorhis, Emily Salisbury, Emily Wright, and Ashley Bauman. The instrument is now managed by Dr. Emily Salisbury at Utah Criminal Justice Center (UCJC), College of Social Work University of Utah.
The WRNA is a public-domain instrument. However, there are conditions of use, a license agreement, and training costs associated with its implemenation.
This webpage from Utah Criminal Justice Center (UCJC), College of Social Work University of Utah has links to research articles written about the WRNA over the last 13 years.

10 tech-related trends that shaped the decade

The tech landscape has changed dramatically over the past decade, both in the United States and around the world. There have been notable increases in the use of social media and online platforms (including YouTube and Facebook) and technologies (like the internet, cellphones and smartphones), in some cases leading to near-saturation levels of use among major segments of the population. But digital tech also faced significant backlash in the 2010s.

See Full Report

2018 National Survey on Drug Use and Health: Women

National Survey on Drug Use and Health (NSDUH) 2017 Highlights

• Opioids epidemic:
  • New users of heroin significantly decreased relative to 2016
  • Significant decreases in pain reliever misuse were observed for all ages
  • Downward trend in heroin users
  • Estimated 2.1M with opioid use disorder
• Marijuana:
  • Significant increases in use by young adults (18-25 y.o.): past month and daily/near daily use; with significant increases in use by young adult women
  • Pregnant women using substances in greater numbers including significant increases in daily or near daily marijuana use
  • Frequent marijuana use was associated with opioid misuse, heavy alcohol use, and depression in youth 12-17 and young adults 18-25
• Young adults had increasing rates of serious mental illness, major depression, and suicidality
• Co-occurring substance use and mental disorders are common
• Major gaps in treatment received by affected individuals

2018 State & Local Government Finance Historical Datasets and Tables

Statistics on revenue, expenditure, debt, and assets (cash and security holdings) for US governments. There are statistics for the 50 state areas and the District of Columbia, as well as a national summary.

Please read the accompanying documentation for the individual unit file before using these data. It can be found in the .zip file below.          

Public Use File - Data records by state and type of government for each item code (1 amount per record).

Individual Unit Files - Data records with government unit code, item code and amount for all respondents records in the annual sample.

Preliminary state government finance data was released earlier this year and can be viewed here.

2019 State Of The Workplace Exploring the Impact of the Skills Gap and Employment-Based Immigration

The United States is facing a growing skills gap that threatens the nation’s long-term economic prosperity. The workforce simply does not have enough workers and skilled candidates to fill an ever-increasing number of high-skilled jobs. 7 million jobs were open in December 2018, but only 6.3 million unemployed people were looking for work. As the country nears full employment, businesses face an even greater talent shortage that will have a stifling impact on the economy and global innovation. Several factors contribute to the skills gap: low unemployment, new technologies and competition in the global landscape. The fastest growing sectors of the economy—health care and technology— require workers with some of the most highly specialized skills. The talent gap is also visible in the trades, middle-skilled jobs and high-skilled STEM jobs. The skills businesses say are most lacking include data analysis; science; engineering; medical; and trade skills such as carpentry, plumbing, welding and machining. Business and HR leaders view the skills shortage as a top concern that needs to be addressed. Among HR professionals, 75% of those having recruiting difficulty say there is a shortage of skills in candidates for job openings. To address the skills shortage, the United States needs a world-class, highly skilled workforce. This will require training workers, collaborating with educational institutions to improve graduate employability, and competing globally for top talent. Foreign-born talent is a necessary complement to the U.S. workforce as businesses become increasingly interconnected globally. The studies described in this report begin the exploration of the skills gap and foreign-born talent’s role in lessening recruiting difficulty. To supplement these preliminary findings, SHRM will be conducting robust additional studies in 2019 and beyond.

6 Keys to a Tech-Friendly Workplace Culture

Agility requires fast, innovative, customer-centric tech -- and workers aren't ready for it.

Though 73% of U.S. workers say artificial intelligence will eliminate more jobs than it creates, just 18% say they are "extremely confident" they could secure the training they need for digitalization, according to a Gallup/Northeastern University study, Optimism and Anxiety: Views on the Impact of Artificial Intelligence and Higher Education's Response.

And when asked about the skills needed for digitalization, 52% in France, 43% in Germany, 37% in Spain and 30% in the U.K. say the demand for their qualifications will only increase. In no country do more than 9% say the demand for their qualifications will decrease.

Those data points should make leaders uneasy. Especially the last one, which came from a series of interviews Gallup conducted in late 2017 and early 2018 with 80 business leaders and managers in the U.S. and EU about their experiences with agility in their company.

Gallup followed up on that research by interviewing over 5,500 American and 4,000 European workers about perceptions of their company's culture of agility.

The study found agile companies have eight qualities that enable them to be agile, one of which is the ability to adopt new technology.

But most workers don't have that ability.

In fact, business leaders think only about a quarter of their workforce is prepared for AI adoption, according to an MIT Sloan study, though only 3% of leaders are upping their training budget substantially to fill the gap. (Incidentally, 61% of workers say their employer should offer and pay for training, according to the Optimism and Anxiety study.)

To some extent, however, it doesn't matter if companies do fund upskilling or reskilling programs. No matter how well-trained the employees, a slow, inflexible culture can't make much of its tech or its workers. Agile is cultural, not digital, and culture depends on managers and leaders.

A new way to treat women's mental health in prison

Flanked by fig groves and vineyards and surrounded by electrified fences and thick coils of barbed wire, the Central California Women’s Facility is the largest women only prison in the state. Inside the low-slung cinderblock buildings, in a trailer that doubles as a classroom, a dozen prisoners have gathered around a conference table. They are black, white and Latina; former gang members, preschool teachers, musicians and veterans. They have one thing in common. All these women are serving long-term sentences for committing violent offenses. Many of them are LWoPs—life in prison, without the possibility for parole. They’ve come to this classroom to talk about the beginning of their journeys to prison — which almost invariably began with childhood trauma.

A Women’s Typology of Pathways to Serious Crime With Custody and Treatment Implications

Criminal career patterns, social context and features, psychological factors, potential matches in prior pathways research, sub-types, and treatment goals are provided for the following types of women's pathways to crime: "Type 1 - Quasi-Normal non-violent women with drug/alcohol issues"; "Type 2 - Lifelong Victims, many of whom have abusive partners, drug problems and depression"; "Type 3 - Socialized Subcultural Pathways, poor and marginalized but with low victimization and few mental health problems"; "Type 4 - Aggressive Antisocial, high risk/high need and victimized, mental health issues"; [and] women offenders not classified.

After Incarceration: A Guide To Helping Women Reenter the Community

As of 2016, over 1.2 million women in the United States were incarcerated in prison or jail, on probation, or on parole. Since 2000, the rate of women’s incarceration in jails rose over 26 percent, whereas the jail incarceration rate for men decreased by 5 percent. When women are released from jail or prison, they are often ill-prepared to reencounter and address the serious problems they faced prior to incarceration, such as victimization, an unstable family life, difficulties in school, limited work experience, financial issues, poverty, substance use disorders, mental health issues, a lack of vocational skills, and parenting difficulties. Women also tend to face new concerns upon reentering society, such as legal issues, financial restitution, and new trauma or re-traumatization that they experienced while incarcerated. There are few randomized studies that have identified gender-responsive, evidence-based practices for women’s reentry. In many communities, women receive the same services that were originally designed to serve men being released from jail or prison. However, new findings, such as those from the Office on Women’s Health’s 2012–2015 Reentry Enhancement Project, are helping to identify effective approaches for women’s reentry. This guide provides an overview of promising practices that corrections and community-based service providers should consider in supporting women’s transitions from correctional facilities to the community. Gender-responsive criminal justice approaches acknowledge women’s unique pathways into and out of the criminal justice system. These approaches address social factors such as poverty, race, class, gender inequality, and culture. The promising practices presented here align with a theoretical framework, created by Bloom, Owens, and Covington, that explains the complex dimensions of a woman’s experience when reentering the community following incarceration.

Age Diversity In The Workplace

Older Americans feel their generation is discriminated against in the workplace and consider thier own age to be a detriment when looking for a job. Additionally, about a fifth of workers age 50 and older feel they have been passed over for promotion or raises due to thier age. 

The 2019 Working Longer Survey explores the public's view on age diversity in the workplace given the trend toward deplayed retirement. 

An Unsupported Population: The Treatment of Women in Texas’ Criminal Justice System

In March 2018, The Texas Criminal Justice Coalition released a report, A Growing Population: The Surge of Women into Texas’ Criminal Justice System, which examines the growing number of women entering Texas’ criminal justice system and offers recommendations for safely reducing this population and helping women thrive in the community.

This report, the second in this two-part series, takes a closer look at the issues facing women who are currently incarcerated. The centerpiece of this report is a survey of women conducted to learn more about their experiences prior to and during incarceration. As the survey results reveal, it is vitally important for agency staff, corrections system practitioners, and policy-makers to acknowledge and address women’s unique needs, to implement policies and practices that treat these women with dignity, to ensure they remain in their children’s lives, and to prepare them for a successful return to their families and our communities.

Annual Determination of Average Cost of Incarceration Fee (COIF)

Title 28 of the Code of Federal Regulations, part 505, allows for assessment of a fee to cover the average cost of incarceration for Federal inmates. We calculate the cost of incarceration fee (COIF) by dividing the number representing the Bureau of Prisons (Bureau) facilities' monetary obligation (excluding activation costs) by the number of inmate-days incurred for the fiscal year, and then by multiplying the quotient by the number of days in the fiscal year. Based on FY 2018 data, FY 2018 COIF was $37,449.00 ($102.60 per day) for Start Printed Page 63892Federal inmates in Bureau facilities and $34,492.50 ($94.50 per day) for Federal inmates in Community Corrections Centers.

Best States 2019: Ranking Performance Throughout All 50 States

Some states shine in health care. Some soar in education. Some excel in both – or in much more. The Best States ranking of U.S. states draws on thousands of data points to measure how well states are performing for their citizens. In addition to health care and education, the metrics take into account a state’s economy, its roads, bridges, internet and other infrastructure, its public safety, the fiscal stability of state government, and the opportunity it affords its residents.

More weight was accorded to some state measures than others, based on a survey of what matters most to people. Health care and education were weighted most heavily. Then came state economies, infrastructure, and the opportunity states offer their citizens. Fiscal stability followed closely in weighting, followed by measures of crime & corrections and a state's natural environment.

Capital Punishment, 2017: Selected Findings

This report presents selected findings from the Bureau of Justice Statistics’ annual data collection on capital punishment. It includes statistics on the number of prisoners executed each year from 1977 through 2017, the number and race of prisoners under sentence of death at year-end 2017 by state, and the average elapsed time from sentence to execution by year from 1977 through 2017. BJS obtained data on prisoners under sentence of death from the department of corrections in each jurisdiction that authorized the death penalty as of December 31, 2017. The status of the death penalty was obtained from the office of the attorney general in each of the 50 states, the District of Columbia, and the federal government. Data covered all persons under sentence of death at any time during the year who were held in a state or federal non-military correctional facility. It included capital offenders transferred from prison to mental hospitals and those who may have escaped from custody. It excluded persons whose death sentences had been overturned in court, regardless of their current incarceration status. 

Center for Gender & Justice

The Center for Gender and Justice (CGJ) seeks to develop gender-responsive policies and practices for women and girls who are under criminal justice supervision. The Center is committed to research and to the implementation of policies and programs that will encourage positive outcomes for this underserved population.  Being gender responsive means creating an environment through site selection, staff selection, program development, content, and material that reflects an understanding of the realities of the lives of women and girls and that addresses and responds to their strengths and challenges.


Correctional Populations in the United States, 2016

An estimated 6,613,500 persons were under the supervision of U.S. adult correctional systems on December 31, 2016 (figure 1). The adult correctional population consists of persons held in prisons and jails and persons on probation and parole. The correctional population decreased 0.9% from January 1, 2016, to December 31, 2016. From 2007 to 2016, the correctional population declined by an average of 1.2% annually, ranging from a decrease of 0.4% in 2008 to 2.1% in 2010. At year-end 2016, about 1 in 38 persons in the United States were under correctional supervision. This report summarizes data from several Bureau of Justice Statistics (BJS) collections on populations supervised by adult correctional systems in the United States. (See Methodology.) 

Correctional Programming and Gender

As the number of women under correctional supervision continues to increase in the United States, attention to gender within correctional programming is crucial as women offenders present with different concerns than their male counterparts. Gender differences exist in a range of criminal justice factors, including pathways to involvement in the criminal justice system, frequencies in types of offenses, treatment needs, and facilitating factors for treatment engagement and positive outcomes. Thus, this chapter highlights the importance of gender in terms of correctional program design and delivery. Gender-responsive programming for women involved in the criminal justice system is guided mainly by the feminist pathways theory of women’s criminality, as well as additional theories. This framework considers the interconnected roles of trauma and victimization histories, substance abuse, economic and social marginalization, and the gendered effects of criminal justice policies and practices. For gender-responsive programming, elements that should be considered in women’s treatment and services in correctional settings include: program environment or culture or both, staff competence, theoretical foundations, treatment modalities, reentry issues, and collaboration. In addition, principles of trauma-informed care are crucial elements needed in systems and services for women involved in the criminal justice system. These two frameworks of gender-responsive programming and trauma-informed care offer specific principles that can be applied across correctional settings for women to shape policies, programming design, program delivery, and daily practices. Likewise, these frameworks encourage community-based responses to women’s involvement in criminal behaviors. Gender is a crucial element for correctional programming in multiple ways

Countering Threats to Correctional Institution Security

Some threats to correctional institutional security — e.g., violence, escape attempts, contraband — are as old as the institutions themselves, while other threats — e.g., computer hacking, synthetic drugs, cell phones, drones — have evolved with societal and technological changes. Many of these threats present risks to public safety as a whole. In light of the ongoing challenges the corrections sector faces in countering these threats, RAND researchers convened an expert workshop to better understand the challenges and identify the high-priority needs associated with threats to institutional security.

Unfortunately, resource and staffing challenges limit the ability of correctional institutions to adapt to shifts in threats and to adjust security and staffing strategies over time. Furthermore, a perpetual lack of empirical data hampers efforts to effectively develop interventions to address threats. Addressing the research needs and developing the tools and resources — as prioritized by the workshop participants — is one route to providing correctional institutions the support needed to confront security threats going forward.

D.C. Women in Prison: Continuing Problems and Recommendations for Change

Over 20 years ago, in litigation challenging conditions for women in District of Columbia prisons, a federal district court found widespread violations of the women’s rights, citing unsanitary and otherwise substandard living conditions, inadequate medical care, and educational, recreational, and religious   opportunities that were inferior compared with those available to men housed in the same facilities. The court also found evidence  of  “a level of sexual harassment which is so malicious that it violates contemporary standards of decency,” with reports of rape, “general acceptance of sexual relationships between staff and inmates,” unconsented sexual touching, and degrading remarks. There have been changes –in many cases for the better –since the court made these findings in 1994.  But D.C. women who are incarcerated continue to encounter serious challenges, both during their imprisonment and  when they return to the community.  This report addresses conditions these women currently face and discusses some of the more significant problems they experience during incarceration.  The report focuses primarily on the Correctional Treatment Facility (CTF), a jail facility located in the District that is operated  by Corrections Corporation of America (CCA), and the Hazelton Secure Female Facility (SFF), a federal prison in West Virginia where the largest numberof D.C. women convicted of felonies are housed.

Designing ‘Healthy’ Prisons for Women: Incorporating Trauma-Informed Care and Practice (TICP) into Prison Planning and Design

There has been growing acknowledgment among scholars, prison staff, and policy-makers that gender-informed thinking should feed into penal policy but must be implemented holistically if gains are to be made in reducing trauma, saving lives, ensuring emotional wellbeing, and promoting desistance from crime. This means that not only healthcare services and psychology programs must be sensitive to individuals’ trauma histories but that the architecture and design of prisons should also be sympathetic, facilitating, and encouraging trauma-informed and trauma-sensitive practices within. This article problematizes the Trauma-Informed Care and Practice (TICP) initiatives recently rolled out across the female prison estate, arguing that attempts to introduce trauma-sensitive services in establishments that are replete with hostile architecture, overt security paraphernalia, and dilapidated fixtures and fittings is futile. Using examples from healthcare and custodial settings, the article puts forward suggestions for prison commissioners, planners, and architects which the authors believe will have novel implications for prison planning and penal practice in the UK and beyond.

Employee Engagement: Maximizing Employee Potential

Though technology and the workplace are changing, human nature isn't.

In our studies of the world's most successful organizations, we've learned that a culture of high employee development is the most productive environment for both businesses and employees.

Download Building a High-Development Culture Through Your Employee Engagement Strategy to learn:

  • why engagement cannot be "just an HR thing"
  • the fundamental needs that must be met for employees to achieve high performance
  • the patterns seen in organizations that have successfully transformed into high-development cultures driven by engagement

Employer Perspectives on Workforce Development How businesses are adapting to the future of work

The nature of work is rapidly changing due to emerging technologies and disruptive forces, such as AI, the gig economy, and more. The exact effect of these and other changes remain unknown, but one thing seems certain: The skills that employers value and rely upon are evolving. In turn, a “skills gap” has developed in which employers struggle to hire appropriately trained workers.

While it will take many groups across the workforce spectrum to address this issue, employers play an important role in identifying related challenges and subsequently creating and refining innovative solutions. As such, exploring how employers experience and respond to these challenges is a valuable part of the larger conversation on workforce development.

By interviewing several employers directly, this series seeks to provide on-the-ground insight into how employers encounter and address these challenges. Further, this series situates each employer’s experience in research and recommendations related to the skills gap and workforce development more broadly. The series concludes with a post that reflects on the insights shared by employers, identifying themes, promising solutions, and potential next steps for policymakers.

Examining Perpetration of Physical Violence by Women: The Influence of Childhood Adversity, Victimization, Mental Illness, Substance Abuse, and Anger

Research on women's perpetration of physical violence has focused primarily on partners, often neglecting perpetration against nonpartners. This study proposes a conceptual model with direct and indirect relationships between childhood adversity and different targets of violence (partners and nonpartners), mediated by victimization experiences (by partner and nonpartners), mental illness, substance abuse, and anger. Using survey data from a random sample of incarcerated women (N = 574), structural equation modeling resulted in significant, albeit different, indirect paths from childhood adversity, through victimization, to perpetration of violence against partners (β = .20) and nonpartners (β = .19). The results indicate that prevention of women's violence requires attention to specific forms of victimization, anger expression, and targets of her aggression.

Facing the Future: U.S., U.K. and Canadian citizens call for a unified skills strategy for the AI age

Representing the views of 10,000 adults in Canada, the U.S. and the U.K., and including interviews with chief human resources officers at 10 large corporations based in these three countries, this study from Northeastern University and Gallup measures perceptions of the impact of artificial intelligence on jobs, as well as the education choices respondents would make in response and their confidence in higher education, government and business to plan for widespread AI adoption.

Key findings:

  • In all three countries, few see higher education as doing a good job preparing current or future workers for the workforce.
  • Most of the adults in these countries would not look to higher education as the first source for new skills and training to respond to AI adoption.
  • Nearly all, in all three countries surveyed, see the value of lifelong learning.
  • Many in all three countries question the value of a degree from a traditional college or university.

Federal Bureau of Prisons - Female Offenders

Women account for approximately 7 percent of the federal inmate population. Nationwide, women are a growing correctional population, however in the Bureau of Prisons, women have maintained a steady proportion of the overall population. The Bureau houses women in 29 facilities across the country.

Women in Bureau custody are offered many of the same educational and treatment programs that are available to male offenders; however, women in prison differ from their male counterparts in significant ways. For example, women are more likely to experience economic hardship, employment instability, and fewer vocational skills as compared with males. Since they are more likely than men to have a history of trauma and abuse, which poses additional challenges for reentry, specialized initiatives and programs that are trauma-informed and address women's gender-based needs are offered at female facilities.

Fiscal 50: State Trends and Analysis

Fiscal 50: State Trends and Analysis, an interactive resource from The Pew Charitable Trusts, allows you to sort and analyze data on key fiscal, economic, and demographic trends in the 50 states and understand their impact on states’ fiscal health.

States showed fiscal and economic strength before pandemic

The coronavirus outbreak in early 2020 was expected to abruptly end the longest U.S. economic expansion on record and with it one of the most promising periods for states’ finances in years. Long-running pressure on state budgets had eased in 2019 amid widespread economic growth and tax revenue gains that led to the first budget surpluses in years in many states. Still, some states were in a stronger position than others as they were about to face a public health emergency and their greatest fiscal and economic test since the Great Recession of 2007-09.

The vast majority of states posted healthy tax revenue gains for July–December 2019, the first half of most states’ current budget year. As of the third quarter of 2019, tax collections in 44 states were higher than at their peaks early in the last recession, after adjusting for inflation. The recent surge in tax revenue had led many to add to their rainy day funds, which as of mid-2019 could cover a larger share of spending than before the previous recession in at least two-thirds of states.

The economy and employment rates were on the upswing through the close of 2019. For the second consecutive year, every state experienced gains in its economy as measured by state personal income—the first time that had happened in more than 10 years.


Following the Money of Mass Incarceration

Our goal with this report is to give a hint as to how the criminal justice system works by identifying some of the key stakeholders and quantifying their “stake” in the status quo. Our visualization shows how wide and how deep mass incarceration and over-criminalization have spread into our economy. We find:

  • Almost half of the money spent on running the correctional system goes to paying staff. This group is an influential lobby that sometimes prevents reform and whose influence is often protected even when prison populations drop.
  • The criminal justice system is overwhelmingly a public system, with private prison companies acting only as extensions of the public system. The government payroll for corrections employees is over 100 times higher than the private prison industry’s profits.
  • Despite the fact that the Constitution requires counsel to be appointed for defendants unable to afford legal representation, the system only spends $4.5 billion on this right. And over the last decade, states have been reducing this figure even as caseloads have grown.
  • Private companies that supply goods to the prison commissary or provide telephone service for correctional facilities bring in almost as much money ($2.9 billion) as governments pay private companies ($3.9 billion) to operate private prisons.
  • Feeding and providing health care for 2.3 million people — a population larger than that of 15 different states — is expensive.

Gender Inequality, Work Hours, and the Future of Work

Gender differences in paid and unpaid time at work are an important aspect of gender inequality. Women tend to spend more time on unpaid household and family care work, and men spend more time in paid work. This unequal distribution of time creates barriers to women’s advancement at work and reduces women’s economic security.

Technological innovation through machine learning, robotics, and artificial intelligence is likely to automate many tasks and jobs, thus improving productivity, freeing time, and allowing fewer workers to do more. Technological innovation presents an opportunity to rethink the distribution of time spent on paid and unpaid work, tackle the inequality in the division of domestic and care work between women and men, and provide time for upskilling and lifelong learning needed to benefit from future opportunities.

This first section of this report presents analysis on why work hours matter to gender equality, and what role time-related policies may play in reducing gender inequality, and more generally, social and economic inequality. The findings show women’s growing contribution to paid work and highlight that, as women’s average hours at work have increased, men’s have not declined. Inequality in paid and unpaid time has remained particularly stark between mothers and fathers. The report then highlights the growing inequality between those who work a lot and those who work intermittently, part-time, or part-year. In addition, the analysis shows that this polarization in paid time at work is increasingly exacerbating racial inequalities.

The second section of the report focuses on changes in the quality of time at work and workforce policies around scheduling, location, and paid time off. The report notes how a growing lack of schedule control and the absence of paid leave rights reinforce economic and racial/ethnic inequalities and are particularly harmful to parents.  The report ends with recommendations to achieve a healthier and more equal distribution of hours worked.

Gender-Responsive Lessons Learned and Policy Implications for Women in Prison: A Review

The authors review evidence of gender-responsive factors for women in prisons. Some gender-responsive needs function as risk factors in prison settings and contribute to women’s maladjustment to prison; guided by these findings, the authors outline ways in which prison management, staff members, and programming can better serve female prisoners by being more gender informed. The authors suggest that prisons provide treatment and programming services aimed at reducing women’s criminogenic need factors, use gendered assessments to place women into appropriate interventions and to appropriately plan for women’s successful reentry into the community, and train staff members to be gender responsive.

Global Competitiveness Report 2019: How to end a lost decade of productivity growth

This year’s Global Competitiveness Report is the latest edition of the series launched in 1979 that provides an annual assessment of the drivers of productivity and long-term economic growth. With a score of 84.8 (+1.3), Singapore is the world’s most competitive economy in 2019, overtaking the United States, which falls to second place. Hong Kong SAR (3rd), Netherlands (4th) and Switzerland (5th) round up the top five. Each indicator, or “pillar” uses a scale from 0 to 100, to show how close an economy is to the ideal state or “frontier” of competitiveness in that area Building on four decades of experience in benchmarking competitiveness, the index maps the competitiveness landscape of 141 economies through 103 indicators organized into 12 themes. Each indicator, using a scale from 0 to 100, shows how close an economy is to the ideal state or “frontier” of competitiveness. The pillars, which cover broad socio-economic elements are: institutions, infrastructure, ICT adoption, macroeconomic stability, health, skills, product market, labour market, the financial system, market size, business dynamism and innovation capability.

Global Financial Stability Report: Lower for Longer

The October 2019 Global Financial Stability Report (GFSR) identifies the current key vulnerabilities in the global financial system as the rise in corporate debt burdens, increasing holdings of riskier and more illiquid assets by institutional investors, and growing reliance on external borrowing by emerging and frontier market economies. The report proposes that policymakers mitigate these risks through stricter supervisory and macroprudential oversight of firms, strengthened oversight and disclosure for institutional investors, and the implementation of prudent sovereign debt management practices and frameworks for emerging and frontier market economies.

Global Growth to Weaken to 2.6% in 2019, Substantial Risks Seen

Emerging, developing economies’ growth to pick up to 4.6% in 2020 from 4% in 2019; expansion vulnerable to trade, financial disruptions

Global economic growth is forecast to ease to a weaker-than-expected 2.6% in 2019 before inching up to 2.7% in 2020. Growth in emerging market and developing economies is expected to stabilize next year as some countries move past periods of financial strain, but economic momentum remains weak.

Emerging and developing economy growth is constrained by sluggish investment, and risks are tilted to the downside. These risks include rising trade barriers, renewed financial stress, and sharper-than-expected slowdowns in several major economies, the World Bank says in its June 2019 Global Economic Prospects: Heightened Tensions, Subdued Investment. Structural problems that misallocate or discourage investment also weigh on the outlook.

Global Peace Index 2019

The Global Peace Index 2019 report finds that the average level of global peacefulness improved very slightly in the 2019 GPI. This is the first time the index has improved in five years. The average country score improved by -0.09 per cent, with 86 countries improving, and 76 recording deteriorations. The 2019 GPI reveals a world in which the conflicts and crises that emerged in the past decade have begun to abate, but new tensions within and between nations have emerged.

Gross Domestic Product by State: 4th Quarter and Annual 2019

Washington had the fastest growth in the fourth quarter

Real gross domestic product (GDP) increased in 48 states and the District of Columbia in the fourth quarter of 2019, according to statistics released today by the U.S. Bureau of Economic Analysis. The percent change in real GDP in the fourth quarter ranged from 3.4 percent in Washington and Utah to -0.1 percent in West Virginia (table 1).

Retail trade; finance and insurance; government; and utilities were the leading contributors to the increase in real GDP nationally (table 2). Retail trade was the leading contributor to the increase in real GDP in Washington, the fastest growing state.

Other highlights

  • Retail trade increased 7.4 percent nationally and contributed to growth in all 50 states and the District of Columbia (GDP by Industry table 1).
  • Finance and insurance increased 5.1 percent nationally and contributed to growth in all 50 states and the District of Columbia. This industry was the leading contributor to growth in Arizona, the third fastest growing state.
  • Government increased 2.7 percent nationally and contributed to growth in 49 states and the District of Columbia. This industry was the leading contributor to growth in Utah, the second fastest growing state.
  • Utilities increased 23.3 percent nationally and contributed to growth in all 50 states and the District of Columbia.

Housing Crunch Sends Bigger Populations to Smaller Towns

Cities with fewer than 200,000 residents grew faster than larger metropolises between 2017 and 2018 as high housing prices chased many people away from big cities and their closest suburbs.

The biggest cities grew by a collective 326,000 people, less than half the number earlier in the decade, and less than the number for smaller cities — 421,000 for cities with populations between 10,000 and 50,000.

And small towns of fewer than 10,000 people grew more quickly than earlier in the decade, attracting more than 142,000 new people last year, according to a Stateline analysis of U.S. Census Bureau estimates, driven in part by retirees seeking affordable housing.

How Libraries are Embracing Artificial Intelligence

In Roanoke County, Virginia, a trip to the public library might include reading, online research, 3D printing—and, since last summer, the opportunity to chat with Pepper, a 4-foot-tall humanoid robot who sings, dances and teaches coding classes.

The Roanoke County Public Library was the first public system in the country to acquire Pepper, a decision made by staff members during a strategic planning session that focused largely on how the library hoped to evolve in a modern world increasingly focused on technology. During that discussion, someone mentioned that they’d heard of a robot named Pepper.

Immigration, Citizenship, and the Federal Justice System, 1998-2018

This report highlights trends in federal arrests and prosecutions by the country of citizenship of persons processed through the federal criminal justice system. It shows changes from 1998 through 2018. The report provides statistics on law enforcement and prosecutions along the U.S.-Mexico border, as well as in non-border areas. It shows the number of suspects arrested and prosecuted for both immigration and non-immigration offenses, including by their citizenship status. It details activities for all 94 federal judicial districts, while also separately detailing activities for the 5 districts along the U.S.-Mexico border. (See map on page 6.) The statistical findings in this report are based on data from the Bureau of Justice Statistics’ Federal Justice Statistics Program (FJSP). The FJSP receives administrative data from six federal justice agencies: the U.S. Marshals Service, Drug Enforcement Administration, Executive Office for U.S. Attorneys, Administrative Office of the U.S. Courts, U.S. Sentencing Commission, and Federal Bureau of Prisons. BJS links and standardizes this information to maximize comparability and to facilitate analysis across and within agencies over time. 

Incarcerated Women and Girls

Over the past quarter century, there has been a profound change in the involvement of women within the criminal justice system. This is the result of more expansive law enforcement efforts, stiffer drug sentencing laws, and post-conviction barriers to reentry that uniquely affect women. The female incarcerated population stands nearly eight times higher than in 1980. More than 60% of women in state prisons have a child under the age of 18.1)
Between 1980 and 2017, the number of incarcerated women increased by more than 750%, rising from a total of 26,378 in 1980 to 225,060 in 2017.

Incorporating Location Tracking Systems Into Community Supervision

For several decades, supervision agencies have been leveraging a variety of technological innovations to better manage justice-involved individuals in the community. Perhaps no tool has captured the imagination of the criminal justice professionals and the public alike as much as location tracking system (LTS) technology, first introduced in 1996. The ability to track an individual in near-real time represented a substantial improvement over the previous technology, which was limited to monitoring an individual’s presence at a fixed location, usually the home.

Since that time, the use of location tracking has achieved acceptance within the criminal justice system. Further, use of an LTS is generally supported by the public, judges, and legislators, who believe this level of monitoring provides greater accountability and control for individuals in the community. By some measures LTS usage is growing rapidly. According to a 2015 survey by the Pew Charitable Trusts, more than 88,0001 individuals were supervised using an LTS, a thirtyfold increase from the roughly 2,900 reported a decade earlier (Pew Charitable Trusts, 2015). Despite this rapid growth, those under supervision with location tracking represent little more than 1% of the nearly seven million individuals under correctional control and under 2% of the 4.6 million on probation or parole supervision. 

Jail Inmates in 2018

County and city jails in the United States held 738,400 inmates at midyear 2018 (table 1), a decline of 6% from 785,500 inmates held in 2008. The midyear population remained relatively stable from 2011 to 2018. At midyear 2018, about one-third of jail inmates (248,500) were sentenced or awaiting sentencing on a conviction, while about two-thirds (490,000) were awaiting court action on a current charge or were held for other reasons. Over the 10-year period from 2008 to 2018, the rate of incarceration in local jails dropped by 12%, from 258 inmates per 100,000 U.S. residents to 226 per 100,000 (fgure 1). During this period, the jail incarceration rate increased by 12% for whites and declined by about 30% for blacks (28%) and Hispanics (33%). Findings in this report are based on the Annual Survey of Jails (ASJ), a national survey of county, city, and regional jails. Since 1982, the Bureau of Justice Statistics has conducted the ASJ to provide nationwide statistics on the number and characteristics of local jail inmates, inmate turnover, jail capacity, and the usage of jail space. 

Leveraging Technology to Enhance Community Supervision

Key Findings

Technology solutions could improve officer safety and skills

  • Technology can be leveraged to train officers more effectively on basic skills and evidence-based interventions, assess whether they are implementing that training with fidelity, and facilitate a timely feedback loop. Given an increasing emphasis on providing supervision services in the communities where offenders live and work, technology should be leveraged to enhance officers' ability to work in the field. One key aspect is safety; advanced emergency duress systems should be developed and evaluated to determine their impact on lone-worker safety.
  • Technology can assist in the delivery of evidence-based interventions known to reduce recidivism. Automated tools are needed to help officers identify the most criminogenic needs to target with a particular offender. As agencies consider transitioning to community-based supervision, research is needed to evaluate the impact of a more mobile workforce. Best practices also are needed to guide agencies as they implement mobility strategies.

Technology can help maintain accountability and facilitate positive behavioral change

  • The use of location-monitoring technologies is increasing, and there are significant associated costs in terms of equipment and officer workload. Research is needed to guide implementation of these technologies to achieve desired outcomes. Evaluations are needed to determine the most effective technology-based approaches to supervising lower-risk offenders.

Technology can help agencies improve their operations

  • The group identified multiple opportunities to improve operational or administrative efficiencies, which would allow for better use of scarce resources. For example, the group participants argued that cost-effective, web-based approaches for victim notification are needed. Furthermore, using modern communication methods (e.g., text) should be explored as a way to maintain contact among officers and offenders between in-person interactions.

Mapping America’s Futures

What will America look like in 2030?

We can already see that the population is aging and becoming more diverse, but how will those trends play out at the local and regional levels? And what if, in the future, we live longer or have more babies? How would those trends affect the population in different cities and states?

These demographic shifts matter a great deal to states and local communities. Las Vegas is scrambling to build enough schools to accommodate the city’s recent population boom. Meanwhile, Detroit is figuring out how to downsize wisely to match a shrinking population that may shrink even more.

To help visualize the future, the Urban Institute developed a tool as part of the “Mapping America’s Futures” series that projects local-level population trends out to 2030 (the button on the right will take you there). Pick low, average, or high rates for birth, death, and migration—the three drivers of population change—and the map changes in response.

The rates are all reasonable assumptions, based on historical trends. In other words, it won’t show a future where no children are born and no one dies, but we could imagine a future where people move around more or birthrates fall by 20 percent. With the tool, people can explore several possible “what-if” scenarios—possible futures—and see how they’ll play out across the country.

A future with more births and longer lives looks very different from one with fewer births and high mortality. And migration—one of the most difficult forces to predict—can change areas rapidly, not just in sheer numbers, but also in terms of an area’s racial and ethnic makeup, its workers and tax base, its demand for housing and for government services, and, arguably, its character.

Mass Incarceration: The Whole Pie 2019

Can it really be true that most people in jail are being held before trial? And how much of mass incarceration is a result of the war on drugs? These questions are harder to answer than you might think, because our country’s systems of confinement are so fragmented. The various government agencies involved in the justice system collect a lot of critical data, but it is not designed to help policymakers or the public understand what’s going on. As public support for criminal justice reform continues to build, however, it’s more important than ever that we get the facts straight and understand the big picture.

This report offers some much needed clarity by piecing together this country’s disparate systems of confinement. The American criminal justice system holds almost 2.3 million people in 1,719 state prisons, 109 federal prisons, 1,772 juvenile correctional facilities, 3,163 local jails, and 80 Indian Country jails as well as in military prisons, immigration detention facilities, civil commitment centers, state psychiatric hospitals, and prisons in the U.S. territories. This report provides a detailed look at where and why people are locked up in the U.S., and dispels some modern myths to focus attention on the real drivers of mass incarceration.


More Than Half of U.S. Adults Trust Law Enforcement to Use Facial Recognition Responsibly

The ability of governments and law enforcement agencies to monitor the public using facial recognition was once the province of dystopian science fiction. But modern technology is increasingly bringing versions of these scenarios to life. A recent investigation found that U.S. law enforcement agencies are using state Department of Motor Vehicles records to identify individual Americans without their consent, including those with no criminal record. And countries such as China have made facial recognition technology a cornerstone of their strategies to police the behaviors and activities of their publics.

National Directory of Programs for Women with Criminal Justice Involvement

The programs on this site are varied in the populations they serve and services provided. This database is intended for correctional stakeholders working across front end decision-making, pre-trial release, jail and prison reentry and covers topical areas such as parenting programs and substance abuse and/or behavioral health. We have found this site to be a resource in correctional case planning, management, and supervision and treatment of women in correctional systems but also as a source of information for those interested in developing programs to serve women.

This database is not an exhaustive listing and we encourage visitors to help us keep the site active by submitting new programs.

Please note, inclusion in this database does not denote a recommendation by NIC. 

National Resource Center on Justice Involved Women

The National Resource Center on Justice Involved Women (NRCJIW) was established to address the complex needs of women involved in the criminal justice system.

The mission of the NRCJIW is to provide guidance and support to criminal justice professionals—and to promote evidence-based, gender-responsive, and trauma-informed policies and practices—in order to reduce the number and improve the outcomes of women involved in the criminal justice system.

To carry out its mision, the Resource Center establishes and maintains this website; conducts outreach activities in service of its mission; and develops policy briefs, tools, and other materials to fill significant resource gaps in the field. It serves as a clearinghouse for model policies and practical tools; a referral source for information, research, and subject matter experts; and a forum for discussion among experts, policymakers, and practitioners about justice involved women. The Resource Center also provides targeted training and technical assistance to state and local criminal justice professionals, policymakers and practitioners.

The National Institute of Corrections (NIC) also delivers products and services to the field specific to justice involved women, and works closely with the Resource Center to assure a coordinated approach.

NIC Services in Managing Justice-Involved Women

While the use of evidence-based practice (EBP) is being used by more and more correctional systems, EBP tend to primarily address the needs of men. Issues specific to females are often overlooked. This void can be filled with gender-specific programming and services. The National Institute of Corrections (NIC) is a reliable resource for information about gender-responsive topics. This article provides a glimpse at the various things NIC offers. Some of these assets are technical assistance, training programs, the Gender-Responsive Bulletin and additional material, and models of practice which can improve operational outcomes.

No Place for Youth: Girls in the Adult Justice System

Over the past three decades, States have enacted legislation making it easier to transfer youth to the adult criminal justice system. Although the process occurs with male and female youth, this document specifically addresses the challenges of transferring girls to adult court and correctional systems. Mechanisms developed to move youth into adult systems include Judicial Waiver/Transfer Laws, Prosecutorial Direct Filing, Statutory Exclusion Provisions, the “Once an Adult, Always an Adult” Provisions and Age of Jurisdiction Laws. When making those transfer decisions, less consideration may be given to the idea that adult jails and prisons are not designed for the confinement of youth, and as a result most are not equipped to meet the inherent and specific needs of adolescents. 

Even in adult facilities housing women, policy and practice were designed and delivered to the majority correctional population, adult men. Further, the physical structure, institutional culture, policies and practices may have the unintended consequences of impeding the physical and emotional safety of girls and exacerbating those very issues that brought them to the attention of the courts. Studies show that when transferring to the adult court system, youth in adult confinement do not receive age-appropriate educational, medical, or rehabilitative services. Additionally, little focus has been directed to policies, programs, classification tools, facilities, and services that are developmentally inappropriate for youth, and in this case, girls. 

While not intended as a research document, this bulletin highlights challenges when transferring juveniles to the adult criminal justice system for administrators and the individual justice involved girls. It is hoped that the audience for this document will extend beyond that of adult and juvenile correctional administrators and reach other related stakeholders who are involved in the decision-making regarding the transfer of juveniles to the adult criminal justice system. (Jim Cosby, Director, p.1)

Occupational Employment and Wages, May 2019: Correctional Officers and Jailers

This Bureau of Labor Statistics page provides information on guard inmates in penal or rehabilitative institutions in accordance with established regulations and procedures. May guard prisoners in transit between jail, courtroom, prison, or other point. Includes deputy sheriffs and police who spend the majority of their time guarding prisoners in correctional institutions.

Occupational Employment and Wages, May 2019: Police and Sheriff's Patrol Officers

This Bureau of Labor Statistics page provides information on how Police and Sheriff's Patrol Officers maintain order and protect life and property by enforcing local, tribal, State, or Federal laws and ordinances. Perform a combination of the following duties: patrol a specific area; direct traffic; issue traffic summonses; investigate accidents; apprehend and arrest suspects, or serve legal processes of courts.

Occupational Employment and Wages, May 2019: Probation Officers and Correctional Treatment Specialists

This Bureau of Labor Statistics page provides information on how Probation Officers and Correctional Treatment Specialists provide social services to assist in rehabilitation of law offenders in custody or on probation or parole. Make recommendations for actions involving formulation of rehabilitation plan and treatment of offender, including conditional release and education and employment stipulations.

On Behalf of Women Offenders Women’s Place in the Science of Evidence-Based Practice

The argument on behalf of women offenders was made at least four decades ago at the National Conference on Corrections convened by then President Richard Nixon in response to the 1971 Attica Prison riots. Among many speakers, Dr. Edith Flynn delivered the only address on women offenders. In “The Special Problems of Female Prisoners,” Dr. Flynn noted that female prisoners were largely ignored. She supported her assertion with reference to the then-recent President’s Commission on Law Enforcement and Administration of Justice (1967), noting that not a “single paragraph or statistic on the female offender could be found in any of the material” (Flynn, 1971:113).She asserted further that the prevailing theories of criminal behavior were inapplicable to women and that the resulting lack of information had adverse implications for managing and treating female offenders. In the intervening years, research has put forward a clearer picture of how women become involved in the justice system and what their treatment needs are when they get there. However, there is clear reason to lament the arduously slowpace in which emerging evidence is impacting policies and front-line practices and services for women (Belknap, 2007; Belknap and Holsinger, 2006; Blanchette and Brown, 2006; Bloom, Owen, and Covington, 2003; Chesney-Lind, 2000; Holtfreter, Reisig, and Morash, 2004; Messina, Grella, Cartier, and Torres, 2010; Reisig, Holtfreter, and Morash, 2006; VanDieten, 2011; VanVoorhis, 2009).

People in Jail in 2019

Researchers from the Vera Institute of Justice, with support from Google.org Fellows, collected data on the number of people in local jails at midyear in both 2018 and 2019 to provide timely information on how incarceration is changing in the United States. This report fills a gap until the Bureau of Justice Statistics releases its report on jail population statistics in 2019—likely in early 2021. Vera researchers estimated the national jail population and jail incarceration rate using a sample of 861 jail jurisdictions. The results are broken down by jurisdiction type and across years, showing diverging trends between urban, suburban, small/midsized metropolitan, and rural areas.

PMIAA: Strengthening the Government Delivery Foundation

Implementing the Program Management Improvement and Accountability Act (PMIAA) is underway by federal agencies covered by the CFO Act. Commissioned and supported with research from PMI, MIT’s Consortium for Engineering Program Management, and others, this report distills how many government agencies have been leading (and continue to lead) efforts to build and sustain good practices in portfolio, program, and project management. 

These activities align with PMIAA’s focus on the use of standards, improved career pathing for talent management, actively engaged executive sponsorship, cross-agency knowledge, and capability/capacity building, etc. The case studies included as part of this report can help agency leaders responsible for PMIAA implementation by providing relevant examples from the U.S. federal government and other government agencies that reflect sound, constantly evolving practices being used. These examples also highlight important lessons learned from the agencies’ experiences and provide contacts in the agencies for further follow-up and support.

Policing Women: Race and gender disparities in police stops, searches, and use of force

Jails have been described as the criminal justice system’s “front door,” but jail incarceration typically begins with the police, with an arrest. Before any bail hearing, pretrial detention, prosecution, or sentencing, there is contact with the police. But despite their crucial role in the process, we know less about these police encounters than other stages of the criminal justice system.

Women make up a growing share of arrests and report much more use of force than they did 20 years ago.

In particular, the experiences of women and girls  – especially Black women and other women of color – are lost in the national conversation about police practices. They are also largely invisible in the the data. But as Andrea Ritchie details in Invisible No More: Police Violence Against Black Women and Women of Color, women, too, are subject to racial profiling, use of excessive force, and any number of violations of their rights and dignity by police. In fact, women make up an increasing share of arrests and report much more use of force than they did twenty years ago. Yet while increasing recognition of women as a growing share of prison and jail populations has prompted facilities to adopt gender-responsive policies and practices, women’s rising share of arrests and other police contact has received less attention and policy response.

Pregnancy Outcomes in US Prisons, 2016–2017

At the end of 2016, there were 111,616 women in prisons across the United States, a 742% increase from the 13,258 women in prisons in 1980. The United States has 4% of the world’s female population but 30% of its female incarcerated population.  Although there has also been an exponential rise among men— as part of the complex political, social, racial, and public health phenomenon known as mass incarceration—the rate of increase of women in custody has outpaced that of men. Nonetheless, there is a dearth of research about gender-specific health conditions among incarcerated women, especially pregnancy.

Three quarters of incarcerated women are of childbearing age (between 18 and 44 years). Two thirds are mothers and the primary caregivers to young children, and up to 84% have been pregnant in the past. In addition, up to 80% of incarcerated women report that they had been sexually active with men in the 3 months before their incarceration, and only 21% to 28% were using a reliable method of contraception. Thus, some women will enter prison pregnant. Yet, to our knowledge, there are no systematic reports of pregnancy outcomes in US prisons.

Prison pregnancy data are critical in ensuring that incarcerated women’s pregnancy-related health care needs are addressed and in helping optimize outcomes for them and their newborns. The far-reaching consequences of the health of incarcerated people for the public’s health and that of broader society are well documented; these consequences are compounded for incarcerated pregnant women given that incarceration affects not only their health but also that of subsequent generations.

Prisoners in 2018

From the end of 2017 to the end of 2018, the total prison population in the United States declined from 1,489,200 to 1,465,200, a decrease of 24,000 prisoners. Tis was a 1.6% decline in the prison population and marked the fourth consecutive annual decrease of at least 1%. Te combined federal and state imprisonment rate, based on sentenced prisoners (those sentenced to more than one year), fell 2.4% from 2017 to 2018, declining from 441 to 431 prisoners per 100,000 U.S. residents. Across a decade, the imprisonment rate—the proportion of U.S. residents who are in prison—fell 15%, from 506 sentenced prisoners in 2008 to 431 in 2018 per 100,000 U.S. residents (fgure 1). During that time, the imprisonment rate dropped 28% among black residents, 21% among Hispanic residents, and 13% among white residents. It also dropped among both men (down 15%) and women (down 9%). Te imprisonment rate overall was lower in 2018 (431 sentenced prisoners per 100,000 U.S. residents) than at any time since 1996 (427). 

Probation and Parole in the United States, 2016

An estimated 4,537,100 adults were under community supervision as of December 31, 2016 (year-end), a decline of 1.1% from 4,586,900 on January 1, 2016 (figure 1 and table 1).* An estimated one in 55 adults in the United States were under community supervision at year-end 2016. Persons on probation accounted for the majority (81%) of adults under community supervision. The decline observed in the adult community corrections population in 2016 was the result of a decrease in the probation population. The probation population declined 1.4%, from an estimated 3,725,600 offenders on January 1, 2016, to 3,673,100 at year-end 2016 (figure 2). The parole population continued to grow, increasing by 0.5%, from 870,500 persons at year-end 2015

QuickFacts - United States

QuickFacts provides statistics for all states and counties, and for cities and towns with a population of 5,000 or more.

Value Notes

Estimates are not comparable to other geographic levels due to methodology differences that may exist between different data sources.

Some estimates presented here come from sample data, and thus have sampling errors that may render some apparent differences between geographies statistically indistinguishable. Click the Quick Info icon to the left of each row in TABLE view to learn about sampling error.

The vintage year (e.g., V2019) refers to the final year of the series (2010 thru 2019). Different vintage years of estimates are not comparable.

Fact Notes

  • (a)Includes persons reporting only one race
  • (b)Hispanics may be of any race, so also are included in applicable race categories
  • (c)Economic Census - Puerto Rico data are not comparable to U.S. Economic Census data

Value Flags

  • -Either no or too few sample observations were available to compute an estimate, or a ratio of medians cannot be calculated because one or both of the median estimates falls in the lowest or upper interval of an open ended distribution.
  • DSuppressed to avoid disclosure of confidential information
  • FFewer than 25 firms
  • FNFootnote on this item in place of data
  • NData for this geographic area cannot be displayed because the number of sample cases is too small.
  • NANot available
  • SSuppressed; does not meet publication standards
  • XNot applicable
  • ZValue greater than zero but less than half unit of measure shown

QuickFacts data are derived from: Population Estimates, American Community Survey, Census of Population and Housing, Current Population Survey, Small Area Health Insurance Estimates, Small Area Income and Poverty Estimates, State and County Housing Unit Estimates, County Business Patterns, Nonemployer Statistics, Economic Census, Survey of Business Owners, Building Permits.

Reentry Tipsheets for Women

The series, Reentry TIPSHEETS for Women, is designed to help correctional staff and other supportive stakeholders, who are working with women during the pre-release planning process and during reentry to address their needs as they transition to the community.  The tipsheets are an important resource for staff to use as a component of their ongoing discussions with the woman during her reentry planning process, and as a reminder of discussions and plans that have been identified during her period of incarceration. They are not intended to be handouts merely given to women on their way out the jail or prison door. Of necessity the Reentry TIPSHEETS for Women cover each topic generally and provide links to national resources. They will be most helpful when they can be paired with specific, on-the-ground resources that are available in the communities where each returning women lives.

Reimagining the Workforce Development and Employment System for the 21st Century and Beyond

Although nearly two decades have elapsed since the turn of the 21st century, the U.S. approach to education, training, and workforce development still largely operates on a 20th-century model. Workforce preparation — a linear pipeline from K–12 education to possibly college and then a job — is similar to what it was several decades ago. Labor market policies designed for the industrial age still prevail. Labor market signals and other information flows between members of the current and future workforce, education and training institutions, and employers have not kept pace with the revolutionary changes in information processing. New technologies are often viewed as threats to the world of work rather than as opportunities to enable the labor force to be agile and adaptable to further innovation and change.

Recognizing the value of interdisciplinary collaboration and systems thinking, RAND Corporation researchers, supported by RAND Corporation investment funds, conducted this study to develop a systems-level, blue-sky approach to conceptualizing and visualizing a 21st-century U.S. workforce development and employment system. This report is the first step in moving the United States to a system that accounts for workers' needs for lifelong learning, employers' continuously changing workforce requirements, rapid and often disruptive changes in technology, and the ever-evolving nature of work. This publication should be of interest to educators, business leaders, policymakers, researchers, and other stakeholders who are engaged in issues relating to workforce education and training and the future of work.

Research on body‐worn cameras What we know, what we need to know

This article provides a comprehensive narrative review of the research on evidence base for body‐worn cameras (BWCs). Seventy empirical studies of BWCs were examined covering the impact of cameras on officer behavior, officer perceptions, citizen behavior, citizen perceptions, police investigations, and police organizations. Although officers and citizens are generally supportive of BWC use, BWCs have not had statistically significant or consistent effects on most measures of officer and citizen behavior or citizens’ views of police. Expectations and concerns surrounding BWCs among police leaders and citizens have not yet been realized by and large in the ways anticipated by each. Additionally, despite the large growth in BWC research, there continues to be a lacuna of knowledge on the impact that BWCs have on police organizations and police–citizen relationships more generally.

Review of the Federal Bureau of Prisons’ Management of Its Female Inmate Population

As of September 2016, the Federal Bureau of Prisons (BOP) incarcerated 10,567 sentenced female inmates, representing 7 percent of the total BOP sentenced inmate population of 146,084. Though female inmates compose a small percentage of the nationwide incarcerated population, correctional officials have recognized that in some areas female and male inmates have different needs and BOP has adopted gender-responsive programs and policies that account for these needs. As a continuation of prior U.S. Department of Justice Office of the Inspector General (OIG) reviews examining BOP’s management of certain subpopulations of inmates, including aging inmates and inmates with mental illness in restrictive housing, OIG initiated this review of BOP’s management of female inmates, specifically BOP’s efforts and capacity to ensure that BOP-wide policies, programs, and decisions adequately address the distinctive needs of women. The IG's decision to initiate this review was also informed by members of Congress and public interest groups recently raising concerns about what they consider to be deficiencies in BOP’s current management of female inmates. 

Same is not equal: Policy and Practice for Justice Involved Women

Correcional facilities are challenged to manage the growing popluation of justice involved women. Increasingly, agencies recognize that "one size does not fit all."   Implementing gender-responsive policy, practice, and programming contributes to a more engaged inmate population, reduces disciplinary issues, and contributes positively to reentry planning. Evidence-based practices and population statistics point toward using gender-specific policies for incarcerated women.

Skills and opportunity pathways: Building an inclusive workforce for the future

Artificial intelligence and emerging technologies have enabled automation to scale and pose legitimate workforce threats. However, these innovations are creating new jobs and recreating old ones that together shape the building blocks of a future workforce. This dynamic opportunity engine is driven in large part by a fast expanding innovation ecosystem that combines a bevy of thriving, scaling, and nascent startups and their emerging workforce needs.

As the geography of innovation continues to evolve, the signals emerging from innovation clusters around the country provide crucial opportunity signals that policymakers should harness rather than ignore. Intriguing horizon workforce opportunities, for example, are embedded within this dynamic tapestry of startups and job creation. However, deliberate policies are required to ensure that underrepresented groups are fully included.

The U.S. must consider what innovation and new jobs mean for marginalized groups as innovation changes employers’ demands for workforce talent and shapes the geography where new opportunities are most likely to emerge.

This report presents a framework that engages education policymakers and workforce planners in innovative ways. It assesses the scale and breadth of emerging trends across local job markets and intersects these data with regional innovation hubs to enhance the capacity of policymakers to design data-driven policies tailored to the strengths of individual ecosystems.

State Minimum Wages | 2019 Highlights

Eighteen states began the new year with higher minimum wages. Eight states (Alaska, Florida, Minnesota, Montana, New Jersey, Ohio, South Dakota and Vermont) automatically increased their rates based on the cost of living, while 10 states (Arizona, Arkansas, California, Colorado, Maine, Massacusetts, Missouri, New York, Rhode Island and Washington) increased their rates due to previously approved legislation or ballot initiatives. Other states that will see rate increases during the 2019 calendar year include D.C., Delaware, Michigan and Oregon.

New Jersey enacted AB 15 in February, which will gradually increase the minimum wage rate to $15 by 2024. (The minimum wage for tipped employees will increase to $9.87 over the same period.) The schedule of annual increases was delayed for certain seasonal workers and employees of small employers, and a training wage of 90 percent of the minimum wage was created for certain employees for their first 120 hours of work. 

Illinois enacted SB 1 in February, which will phase in a minimum wage increase to $15 by 2025. The measure also adjusted the youth wage for workers under age 18 (it will gradually increase to $13 by 2025) and created a tax credit program to offset labor cost increases for smaller employers.

Maryland's legislature overrode a gubernatorial veto to enact a measure (SB 280) that phased-in a minimum wage increase to $15 by 2024 (with a delayed schedule of rate increases for smaller employers) and eliminated and the state subminimum wage for employees younger than age 20. 

New Mexico enacted SB 437 in April, which will raise the state minimum wage to $12 by 2023. The measure also established a training wage for high school students and slightly increased the tipped minimum wage. 

Connecticut enacted HB 5004 in May, which will raise the state minimum wage to $15 by 2023. The measure also indexed the minimum wage to the employment cost index. 

Nevada enacted AB 456 in June, which phases in a minimum wage increase over several years. By July 1, 2024, the minimum wage will be $11.00 for employers that offer their employees health benefits and $12.00 for employers that do not offer health benefits. 

State of the Union 2019: How Americans see major national issues

Following a political standoff that briefly delayed his annual speech to the nation, President Donald Trump will deliver his second State of the Union address on Tuesday night. The speech comes amid a debate between Trump and congressional Democrats over border security – one that recently led to the longest federal government shutdown in history.

As Trump’s speech takes the spotlight, here’s a look at public opinion on important issues facing the country, drawn from Pew Research Center’s recent surveys.

Still Worse Than Second-Class: Solitary Confinement of Women in the United States

This report was first published in 2014. Since then, some things have changed for women in solitary confinement—but many things have not. More attention has been placed on women in prison and on solitary confinement in general, but still, little attention has been paid to the specific plight of women in solitary confinement. Although laws, court decisions, and settlement agreements have all limited the use of solitary confinement for certain populations in some jurisdictions, the use of solitary confinement is still rampant in the United States. Vulnerable populations, including pregnant people and women with mental illness, are still being placed into solitary confinement, and not enough is being done to enforce limitations on such placements.

This 2019 version of the report includes updated facts and data and new sections on girls under the age of 18 in solitary confinement, older women in solitary confinement, and immigration detention. These new sections highlight specific populations that are detained at an increasing rate and that may or do suffer special harms due to solitary confinement. For this 2019 version of the report, we also conducted interviews with survivors of solitary confinement and a practitioner. Specifically, we interviewed three women who had experienced solitary confinement themselves and one social worker who provided mental health care to women in solitary confinement. These interviews provided on the-ground, personal stories about what it is like to live in solitary confinement and a deeper understanding of the mental health impacts of this type of experience.

Suburban Jobs Are Growing Fastest, But Urban Jobs Pay More

Suburbs are increasingly not just where Americans live, but where they work. According to the U.S. Bureau of Labor Statistics’ Quarterly Census of Employment and Wages, 32 percent of U.S. employment is in the suburbs of large metropolitan areas—that is, in the medium- and lower-density counties within metropolitan areas that contain at least 1 million people. That is on par with the 32 percent of the population that lives in the suburbs of these metros. (A slight majority of Americans live in suburbs overall, but this analysis looks specifically at suburbs of large metros.)

The latest BLS data show that job growth, like population growth, is faster in these suburbs than in urban counties, smaller metros, and non-metropolitan areas.

Survey Findings State and Local Government Workforce: 2019 Survey

The Center for State and Local Government Excellence (SLGE) has partnered with the International Personnel Management Association for Human Resources (IPMA-HR) and the National Association of State Personnel Executives (NASPE) to conduct an annual survey of public sector human resources professionals since 2009. Survey questions are focused around the workforce changes and challenges their organizations face and the initiatives they put in place to better serve their hiring and retention needs for the future.

This survey was sent to 7,152 members of IPMA-HR and 85 members of NASPE. The online survey was conducted from March 20 to June 3, 2019 by the Center for State and Local Government Excellence (slge.org) with 335 public human resource professionals submitting responses. Unless otherwise noted, charts in this report reflect 2019 data. While a small number of respondents represent federal or other sectors (e.g., non-profits), the data displayed in Figures 2 through Figure 21 represent state and local government respondents only.

While a few of the figures in this report include data from prior survey years, a more longitudinal analysis is available in the 2018 report: "State and Local Government Workforce: 2018 Data and 10 Year Trends".

Hiring and layoffs are key indicators this survey tracks. While hiring has changed modestly in recent years, the share indicating they have instituted layoffs has dropped from 42 percent in 2009 to 7 percent in 2019. Looking at longer-term employment projections, both state and local workforces are anticipated to increase, with a projected growth of 3.8 percent among state employees and 7.4 percent among local employees from 2016 to 2026.1

Benefits continue to be both a key strength for state and local government (with 88 percent indicating their benefits are competitive in the labor market), and an area for continued changes and experimentation. Some of those changes are in the form of adjusting employer/employee contributions to retirement or health care costs, while others have been more non-economic, such as flexible work schedules (51 percent; see Figure 13).

The gig economy is a particular focus for this year’s survey, with respondents indicating both the overall share of the workforce that such workers represent and the impacts on the organization as a whole (e.g., 3.6 percent indicating a significant increase in management flexibility and a total of 10.1 percent indicating a decrease in employee morale).

Finally, as organizations work to attract and retain skilled workers, they have found a variety of approaches to be of value, ranging from a focus on online advertising (83 percent) and social media (51 percent) to employee development programs such as in-house training (67 percent), onboarding (53 percent), and paid family leave (21 percent), as shown in Figures 12 and 20. 

Testing a New Intervention With Incarcerated Women Serving Life Sentences

Purpose: Incarcerated women serving life sentences are a growing subpopulation with multiple mental health needs. However, no existing interventions have been designed for or tested with this population. Method: This study tested a gender-responsive, trauma-informed intervention (Beyond Violence) and examined changes in incarcerated women’s mental health and anger expression. Pre-, post-, and follow-up surveys were administered to two treatment groups with women with life sentences. Multilevel modeling was conducted to assess changes over time for women’s mental health and anger expression and to compare outcomes for women based on time served. Results: Significant positive outcomes were found for all women for some anger measures, and women who had been in prison for less than 10 years started with higher scores on multiple measures and showed significant changes over time. Discussion: This study offers insight into social work practice, policy advocacy, and research for this population of women.

The American Working Conditions Survey Finds That Nearly Half of Retirees Would Return to Work

There are many reasons to help older Americans stay in the workplace, but the best reason could be that they still want to be there. One indication of their workplace satisfaction is the new American Working Conditions Survey (AWCS), which shows that, overall, older workers report having more meaningful work and more workplace flexibility than their younger peers.

This brief focuses on comparing the working conditions experienced by older workers (ages 50 and above) with those of their prime-age peers (ages 35–49), based on their responses to questions posed by the AWCS. The AWCS examined a large number of workplace issues for all workers ages 25–71. The survey had a 64-percent response rate and a large sample of 3,131 respondents. This brief focuses on comparisons that have statistically significant results — meaning that they are unlikely to have been caused by chance.

The Bangkok Rules: United Nations Rules for the Treatment of Women Prisoners and Non-custodial Measures for Women Offenders

The United Nations Rules for the Treatment of Women Prisoners and Non-custodial Measures for Women Offenders (‘the Bangkok Rules’) were adopted by the UN General Assembly in December 2010 and fill a long-standing lack of standards providing for the specific characteristics and needs of women offenders and prisoners.

Historically, prisons and prison regimes have almost invariably been designed for the majority male prison population – from the architecture of prisons, to security procedures, to healthcare, family contact, work and training.

The 70 Rules give guidance to policy makers, legislators, sentencing authorities and prison staff to reduce the imprisonment of women, and to meet the specific needs of women in case of imprisonment.

The Company Store: A Deeper Look at Prison Commissaries

To bring some clarity to this bread-and-butter issue for incarcerated people, we analyzed commissary sales reports from state prison systems in Illinois, Massachusetts, and Washington. We chose these states because we were able to easily obtain commissary data, but conveniently, these three states also represent a decent cross section of prison systems, encompassing a variety of sizes and different types of commissary management.

We found that incarcerated people in these states spent more on commissary than our previous research suggested, and most of that money goes to food and hygiene products. We also discovered that even in state-operated commissary systems, private commissary contractors are positioned to profit, blurring the line between state and private control.

Lastly, commissary prices represent a significant financial burden for people in prison, even when they are comparable to those found in the "free world." Yet despite charging seemingly "reasonable" prices, prison retailers are able to remain profitable, which raises serious concerns about new digital products sold at prices far in excess of market rates.

The Economies Adding the Most to Global Growth in 2019

The Economies Adding the Most to Global Growth in 2019

Global economics is effectively a numbers game.

As long as the data adds up to economic expansion on a worldwide level, it’s easy to keep the status quo rolling. Companies can shift resources to the growing segments, and investors can put capital where it can go to work.

At the end of the day, growth cures everything – it’s only when it dries up that things get hairy.

Breaking Down Global Growth in 2019

Today’s chart uses data from Standard Chartered and the IMF to break down where economic growth is happening in 2019 using purchasing power parity (PPP) terms. Further, it also compares the share of the global GDP pie taken by key countries and regions over time.

The Employment Situation - October 2019

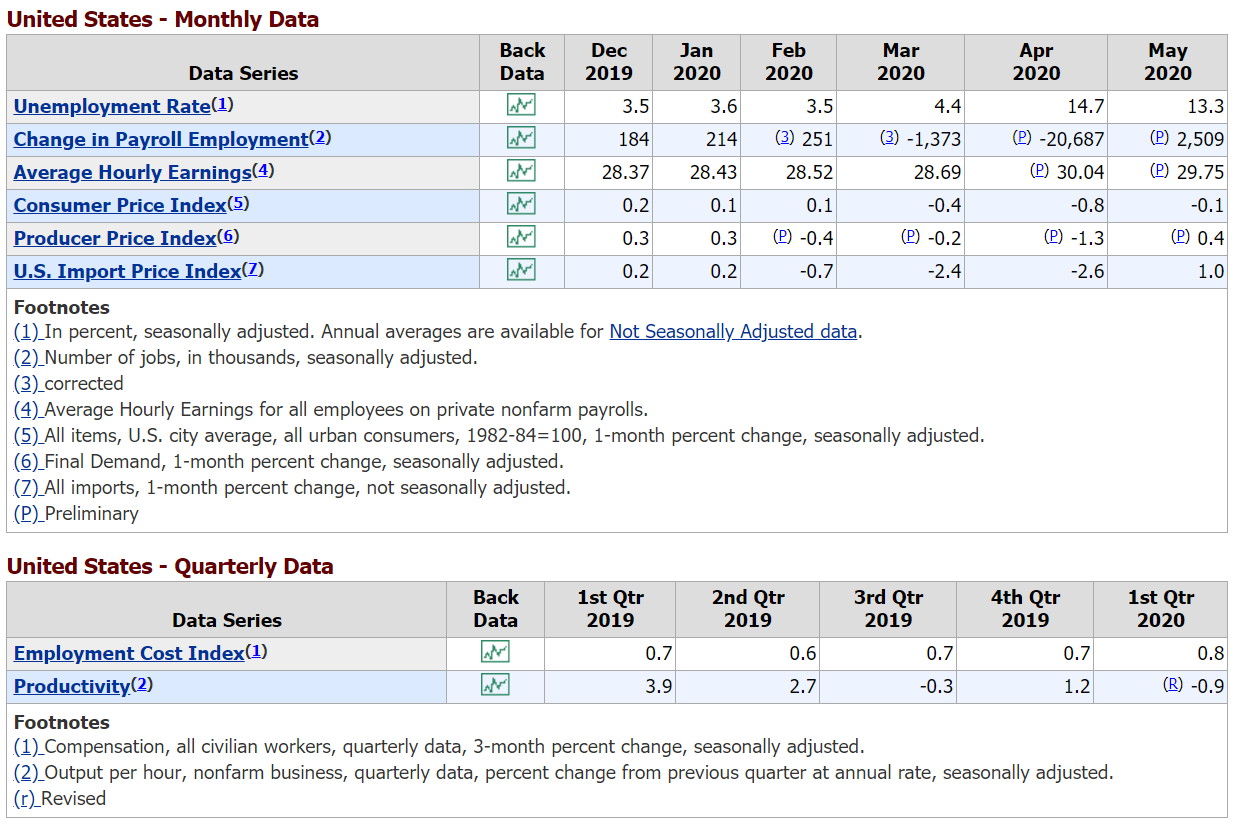
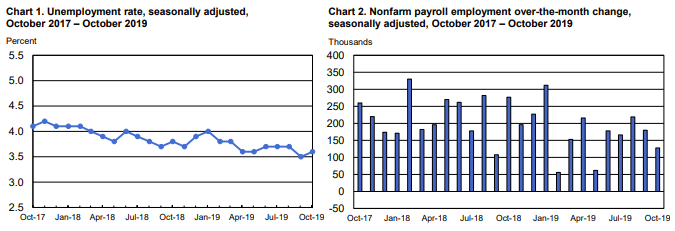
The Bureau of Labor and Statistics provides information on the employment situation. The total nonfarm payroll employment rose by 128,000 in October, and the unemployment rate was little changed at 3.6 percent, the U.S. Bureau of Labor Statistics reported today. Notable job gains occurred in food services and drinking places, social assistance, and financial activities. Within manufacturing, employment in motor vehicles and parts decreased due to strike activity. Federal government employment was down, reflecting a drop in the number of temporary jobs for the 2020 Census. 

Both the unemployment rate, at 3.6 percent, and the number of unemployed persons, at 5.9 million, changed little in October. (See table A-1.) 2.5 3.0 3.5 4.0 4.5 5.0 5.5 Oct-17 Jan-18 Apr-18 Jul-18 Oct-18 Jan-19 Apr-19 Jul-19 Oct-19 Chart 1. Unemployment rate, seasonally adjusted, October 2017 – October 2019 Percent -50 0 50 100 150 200 250 300 350 400 Oct-17 Jan-18 Apr-18 Jul-18 Oct-18 Jan-19 Apr-19 Jul-19 Oct-19 Thousands Chart 2. Nonfarm payroll employment over-the-month change, seasonally adjusted, October 2017 – October 2019 -2- Among the major worker groups, the unemployment rates for adult men (3.2 percent), adult women (3.2 percent), teenagers (12.3 percent), Whites (3.2 percent), Blacks (5.4 percent), Asians (2.9 percent), and Hispanics (4.1 percent) showed little or no change in October. (See tables A-1, A-2, and A-3.) 

The number of long-term unemployed (those jobless for 27 weeks or more) was essentially unchanged at 1.3 million in October and accounted for 21.5 percent of the unemployed. (See table A-12.) 

The labor force participation rate was little changed at 63.3 percent in October, and the employmentpopulation ratio held at 61.0 percent. Both measures were up by 0.4 percentage point over the year. (See table A-1.) 

The number of persons employed part time for economic reasons, at 4.4 million, changed little in October. These individuals, who would have preferred full-time employment, were working part time because their hours had been reduced or they were unable to find full-time jobs. (See table A-8.) 

In October, 1.2 million persons were marginally attached to the labor force, down by 262,000 from a year earlier. (Data are not seasonally adjusted.) These individuals were not in the labor force, wanted and were available for work, and had looked for a job sometime in the prior 12 months. They were not counted as unemployed because they had not searched for work in the 4 weeks preceding the survey. (See table A-16.) 

Among the marginally attached, there were 341,000 discouraged workers in October, down by 165,000 from a year earlier. (Data are not seasonally adjusted.) Discouraged workers are persons not currently looking for work because they believe no jobs are available for them. The remaining 888,000 persons marginally attached to the labor force in October had not searched for work for reasons such as school attendance or family responsibilities. (See table A-16.)

For more data read the full report.

The Federal Budget in 2019: An Infographic

The federal deficit in 2019 was $984 billion, equal to 4.6 percent of gross domestic product. Learn more about the deficit with a new interactive version of the infographic.

The Gender Divide: Tracking Women's State Prison Growth

The story of women’s prison growth has been obscured by overly broad discussions of the “total” prison population for too long. This report sheds more light on women in the era of mass incarceration by tracking prison population trends since 1978 for all 50 states. The analysis identifies places where recent reforms appear to have had a disparate effect on women, and offers states recommendations to reverse mass incarceration for women alongside men.

Across the country, the author's find a disturbing gender disparity in recent prison population trends. While recent reforms have reduced the total number of people in state prisons since 2009, almost all of the decrease has been among men. Looking deeper into the state-specific data, the authors can identify the states driving the disparity.

In 35 states, women’s population numbers have fared worse than men’s, and in a few extraordinary states, women’s prison populations have even grown enough to counteract reductions in the men’s population. Too often, states undermine their commitment to criminal justice reform by ignoring women’s incarceration.

Women have become the fastest-growing segment of the incarcerated population, but despite recent interest in the alarming national trend, few people know what’s happening in their own states. Examining these state trends is critical for making the state-level policy choices that will dictate the future of mass incarceration.

The Gendered Burdens of Conviction and Collateral Consequences on Employment

Ex-offenders are subject to a wide range of employment restrictions that limit the ability of individuals with a criminal background to earn a living. This article argues that women involved in the criminal justice system likely suffer a greater income-related burden from criminal conviction than do men. This disproportionate burden arises in occupations that women typically pursue, both through formal pathways, such as restrictions on occupational licensing, and through informal pathways, such as employers’ unwillingness to hire those with a criminal record. In addition, women have access to far fewer vocational programs while incarcerated. Further exacerbating this burden is that women involved in the criminal justice system tend to be a more vulnerable population and are more likely to be responsible for children than their male counterparts, making legal restrictions on access to public assistance that would support employment more burdensome for women. We propose programs and policies that may ameliorate these gendered income burdens of criminal conviction, including reforms to occupational licensing, improved access to public assistance, reforms to prison labor opportunities, improvements in labor market information sharing, and expanded employer liability protection.

The Number of People in The Average U.S. Household Is Going Up for The First Time in Over 160 Years

Over the course of the nation’s history, there has been a slow but steady decrease in the size of the average U.S. household—from 5.79 people per household in 1790 to 2.58 in 2010. But this decade will likely be the first since the one that began in 1850 to break this long-running trend, according to newly released Census Bureau data. In 2018 there were 2.63 people per household.

Households are increasing in size mathematically because the growth in the number of households is trailing population growth. The newly released data indicates that the population residing in households has grown 6 percent since 2010 (the smallest population growth since the 1930s), while the number of households has grown at a slower rate (4 percent, from 116.7 million in 2010 to 121.5 million in 2018).

The increase in household size is significant because it could have implications for national economic growth. Rising household size reduces the demand for housing, resulting in less residential construction and less demand for home appliances and furniture. In general, it leads to a less vigorous housing sector—fewer apartment leases and home purchases, as well as less spending related to housing, such as cable company subscriptions and home accessories.

The Price of Jails: Measuring the Taxpayer Cost of Local Incarceration

Jails are far more expensive than previously understood, as significant jail expenditures—such as employee benefits, health care and education programs for incarcerated people, and general administration—are often not reflected in jail budgets, but rather in other county agencies. This report surveys 35 jail jurisdictions in 18 states to tally the actual price of their jails—and discovered that the untallied cost of jail can be sizable. More than 20 percent of jail costs were outside the jail budget in nearly a quarter of the surveyed jurisdictions.

The surest way to safely cut jail costs is to reduce the number of people who enter and stay there. In doing so, jurisdictions will be able to save resources and make investments necessary to address the health and social service needs of their communities.

The Price of Prisons: Examining State Spending Trends, 2010 - 2015

From the early 1970s into the new millennium, the U.S. prison population experienced unprecedented growth, which had a direct influence on state budgets. In recent years, however, lawmakers in nearly every state and from across the political spectrum have enacted new laws to reduce prison populations and spending. This report, which builds upon the information found in Vera’s 2012 publication The Price of Prisons: What Incarceration Costs Taxpayers, found that 13 states were successful in reducing both population and spending. However, no single reason explains a rise or fall in spending; instead, a multitude of factors push and pull expenditures in different directions. Read the report and explore our interactive data visualization below to learn more.

These 4 trends are shaping the future of your job

Whether you’re an optimist pointing to predictions of job creation or you’ve been worrying that a robot might be after your job, one thing is for certain. The world of work is going through a period of arguably unprecedented change at the hands of machines; automation and artificial intelligence (AI) are the new kids on the employment block.

Employers need more from their people than ever before if they are to stay relevant and competitive. And similarly, employees expect – even demand – more from the organizations they work for. Now, a global survey of 5,000 human resources professionals and hiring managers, combined with behavioural data analysis, conducted by LinkedIn has revealed the four trends most likely to affect the next few years of your career.

These are the 10 most in-demand skills of 2019, according to LinkedIn

Are you looking for a fresh start in 2019? Maybe you’d like to get fit? Learn a new skill? Or change career?

According to analysis from networking site LinkedIn, 2019’s employers are looking for a combination of both hard and soft skills, with creativity topping the list of desired attributes. The findings chime with the World Economic Forum’s Future of Jobs report, which concluded that “human” skills like originality, initiative and critical thinking are likely to increase in value as technology and automation advances.

To Safely Cut Incarceration, States Rethink Responses to Supervision Violations

Recent research from The Pew Charitable Trusts found that about 4.5 million people in the United States are on community supervision as of 2016. Probation and parole provide a measure of accountability while allowing those who would otherwise have been incarcerated or have already served a term behind bars to meet their obligations to their families, communities, and victims.

People under supervision are expected to follow a set of rules, such as keeping appointments with probation or parole officers, maintaining employment, not using alcohol or other drugs, and paying required fees. Failure to follow the rules—referred to as technical violations—may result in revocation of the supervision and in some cases a term of incarceration. A 2019 report by the Council of State Governments showed that technical violations account for almost 1 in 4 admissions to state prison and $2.8 billion in annual incarceration costs.

Such technical revocations are costly, and failure to comply with supervision conditions does not necessarily indicate that a person presents a public safety threat or will engage in new criminal activity. Further, although studies have not demonstrated that incarcerating people for breaking the rules of supervision reduces recidivism, they have found that long periods of incarceration can make re-entry more difficult, causing people to lose  their jobs, homes, and even custody of their children.

This brief examines policies that states implemented through the Justice Reinvestment Initiative (JRI) that have reduced technical revocations, highlights some of the results of those changes, and provides sample legislation for each policy. JRI is a public-private partnership among Pew, the U.S. Department of Justice’s Bureau of Justice Assistance, state governments, and technical assistance providers; it seeks to improve public safety and control costs by prioritizing prison space for people sentenced for the most serious offenses and investing in evidence-based alternatives to incarceration and other programs shown to reduce recidivism. These state efforts have not been without challenges, and more can be done to improve supervision outcomes. Nevertheless, the examples provided show that states can take meaningful steps to reduce prison populations and protect public safety  while strengthening systems of supervision and services in the community.

Trends in Correctional Control by Race and Sex

American prison populations have long been characterized by racial and ethnic disparities. U.S. Census Bureau data on incarcerated persons from 1870 through 1980 show that black incarceration rates ranged from three to nine times those of whites, depending upon the decade and region of the country. According to Bureau of Justice Statistics (BJS) reports over the past 40 years, black imprisonment rates ranged from about six to about eight times those of whites.
In recent years, racial disparities in imprisonment have decreased. BJS reports have drawn attention to the trend, showing that since the mid-2000s, black and Hispanic incarceration rates have fallen faster than those for whites. These changes also have been noted by media,by advocacy organizations such as The Sentencing Project, and by the National Research Council.
This report updates and advances earlier presentations of data on disparities by examining four questions:
•What are the national-level trends in disparity in probation, parole, jail, and prison populations?
•Are there crime-specific changes in disparity in imprisonment rates?
•Are there differences in disparity by race and sex?
•How have changes in reported offending rates and decisions at the key stages of criminal justice case processing affected black and white imprisonment rates?
The figures and tables that follow present data on these questions. The report describes and analyzes trends in disparity, imprisonment, and criminal justice processing, but the effects of broader social, economic, cultural or political factors on disparity in the criminal justice system are beyond its scope

Trends in the Information Technology sector

The U.S. leads the global landscape in technology innovation. The country’s competitive edge, according to the World Economic Forum’s 2018 Global Competitive Index, is due to its business dynamism, strong institutional pillars, financing mechanisms, and vibrant innovation ecosystem.[1] Innovation is a trademark feature of American competitiveness and has powered its global dominance since the post-World-War industrial revolution. Countries that lead the world in generating advanced technologies and leveraging the full productive capacity of their digital economies can gain a strategic competitive advantage.

U.S. and World Population Clock

The U.S. population clock is based on a series of short-term projections for the resident population of the United States. This includes people whose usual residence is in the 50 states and the District of Columbia. These projections do not include members of the Armed Forces overseas, their dependents, or other U.S. citizens residing outside the United States.

The projections are based on a monthly series of population estimates starting with the April 1, 2010 resident population from the 2010 Census.

At the end of each year, a new series of population estimates, from the census date forward, is used to revise the postcensal estimates, including the population clock projections series. Once a series of monthly projections is completed, the daily population clock numbers are derived by interpolation. Within each calendar month, the daily numerical population change is assumed to be constant, subject to negligible differences caused by rounding.

Population estimates produced by the U.S. Census Bureau for the United States, states, counties, and cities or towns can be found on the Population Estimates web page. Future projections for the United States can be found on the Population Projections web page.

U.S. economy’s current growth will peak in 2019

The U.S. economy has been on a long, slow upward trend for eight years, but a Cornell economist predicts that – like all good things – the steady growth will soon come to an end, likely by the end of the year.

It won’t be a disastrous scenario like the 2009 recession, but rather a garden-variety reaction to the Federal Reserve raising interest rates and, in turn, interest-sensitive sectors cooling off, he said.

“The leading indicators show no signs of immediately slowing down, so I’m not saying the economy’s in bad shape – not at all,” said Steven Kyle, associate professor of applied economics. “Nevertheless, we’re likely nearing the peak of the business cycle in the near future – next year, more likely, but for sure in a year and a half.”

U.S. Prison Population Trends: Massive Buildup and Modest Decline

By yearend 2017, 1.4 million people were imprisoned in the United States, a decline of 7% since the prison population reached its peak level in 2009. This follows a nearly 700% growth in the prison population between 1972 and 2009.

The overall pace of decarceration has varied considerably across states, but has been modest overall. Thirty-nine states and the federal government had downsized their prisons by 2017. Five states—Alaska, New Jersey, Vermont, Connecticut, and New York—reduced their prison populations by over 30% since reaching their peak levels. But among the 39 states that reduced levels of imprisonment, 14 states downsized their prisons by less than 5%. Eleven states, led by Arkansas, had their highest ever prison populations in 2017.

If states and the federal government maintain this pace of decarceration, it will take 72 years—until 2091—to cut the U.S. prison population in half.

The United States has made only modest progress in ending mass incarceration despite a dramatic decline in crime rates. Reported crime rates have plummeted to half of their 1990s levels—as they have in many other countries that did not increase imprisonment levels. Expediting the end of mass incarceration will require accelerating the end of the Drug War and scaling back sentences for all crimes, including violent offenses for which half of people in prison are serving time.

What the next 20 years will mean for jobs – and how to prepare

The next two decades promise a full-scale revolution in our working lives. Before we look into the next 20 years, let’s take a quick look at the present – and something once considered paradoxical.

We’re already living in an age of a lot of robots – and a lot of jobs.

As the number of robots at work has reached record levels, it’s worth noting that in 2018 the global unemployment level fell to 5.2%, according to a report last month – the lowest level in 38 years.

In other words, high tech and high employment don’t have to be mutually exclusive. We’re living the proof of that today.

Given this synchronicity between employment and tech, I believe there are reasons to be hopeful that jobs will become more accessible, more flexible and more liberating over the next two decades.

What the rest of the world can learn from Norway's prison system

Early research on the effects of prison concluded that prisoner rehabilitation programmes do not work (Martinson 1974). This research was influential in rehabilitation gradually taking a back seat in favour of prison policies emphasising punishment and incapacitation. Subsequent scholars questioned the evidence base for this conclusion (Cullen 2005), but as Nagin et at. (2009) summarise, “Remarkably little is known about the effects of imprisonment on reoffending. The existing research is limited in size, in quality, [and] in its insights into why a prison term might be criminogenic or preventative.”

Understanding the effects of imprisonment has proven challenging for two reasons. The first is data availability, since in many countries the required panel datasets on crime and labour market outcomes either cannot be accessed or linked together. Second, which individuals are sent to prison is not random. While simple correlations reveal that ex-convicts have relatively high rates of criminal activity and weak labour market attachment, this could be driven by their unobserved characteristics as opposed to the experience of being in prison. An emerging literature in the past decade has recognised the limitations of correlational data and uses new approaches and new datasets to sort out causal effects.

What Works for Job Training Programs for Disadvantaged Workers

The economic growth that followed the 2008 recession has increased the demand for qualified workers in health care, advanced manufacturing, information technology, and other growing industries. While many employers are finding it difficult to fill key positions, workers without the right skills face a shrinking pool of rewarding job opportunities.

The Office of Workforce Development (OWD) in New Orleans, Louisiana, with a grant from the U.S. Department of Labor, implemented Career Pathways, an innovative program designed to increase the local talent pool and help lower-skilled, unemployed, and underemployed individuals train for work in growing fields. RAND Corporation researchers evaluated the program to find out whether it was succeeding in its mission: helping trainees learn industry-valued skills and find related jobs. The research team also examined the broader costs and benefits of the program in relation to the city of New Orleans.

The team found that the New Orleans Career Pathways program produced meaningful positive results in several areas. These included individuals' wage growth, job satisfaction, and the government's and society's return on investment. There were also areas that had no significant change, such as arrest rates and the duration of individuals' employment.

This brief summarizes the main study findings as well as related recommendations to help workforce development boards, employers, training organizations, and other stakeholders striving to create or improve workforce development programs in their region.

What would it take to achieve quality jobs for all workers?

The nature and organization of work are changing rapidly and in fundamental ways. New technologies, evolving workforce demographics, shifting global demand, and related transformations in business models leave some workers in a precarious position.

Who’s helping the 1.9 million women released from prisons and jails each year?

Given the dramatic growth of women’s incarceration in recent years, it’s concerning how little attention and how few resources have been directed to meeting the reentry needs of justice-involved women. After all, we know that women have different pathways to incarceration than men, and distinct needs, including the treatment of past trauma and substance use disorders, and more broadly, escaping poverty and meeting the needs of their children and families. In recognition of these differences, and in an effort to reduce the harms of incarceration and the likelihood of re-incarceration, many prison systems have begun to implement gender-responsive policies and programs. But what’s being done to help women get the support they need to rebuild their lives after release?

A handful of programs have sprung up in communities around the country to meet the needs of women returning home: some founded by formerly incarcerated women themselves, some running on shoestring budgets for years, and all underscoring the need for greater capacity to meet the demand of over 81,000 releases from prison and 1.8 million releases from jail each year.

Women in Prison: Seeking Justice Behind Bars

This report examines the civil rights of women in United States prisons. The population of women in prison has increased dramatically since the 1980s, and this growth has outpaced that of men in prison, yet there have been few national-level studies of the civil rights issues incarcerated women experience.The Commission studied a range of issues that impact incarcerated women, includingdeprivations of women’s medical needs that may violate the constitutional requirement to provide adequate medical care for all prisoners; implementation of the Prison Rape Elimination Act(PREA); and the sufficiency of programs to meet women’s needs afterrelease. The Commission also examined disparities in discipline practices for women in prison compared with men, and theimpacts of incarcerated women being placed far from home or having their parental rights terminated.

Women in Prison: Seeking Justice Behind Bars

This report examines the civil rights of women in United States prisons. The population of women in prison has increased dramatically since the 1980s, and this growth has outpaced that of men in prison, yet there have been few national-level studies of the civil rights issues incarcerated women experience. The Commission studied a range of issues that impact incarcerated women, including deprivations of women’s medical needs that may violate the constitutional requirement to provide adequate medical care for all prisoners; implementation of the Prison Rape Elimination Act (PREA); and the sufficiency of programs to meet women’s needs after release. The Commission also examined disparities in discipline practices for women in prison compared with men, and the impacts of incarcerated women being placed far from home or having their parental rights terminated.

The Commission majority approved key findings including the following: Many prison policies and facilities are not designed for women or tailored to their specific needs. Rather, many policies were adopted from men’s prison institutions without evaluating their application to women’s prison institutions. Incarcerated women report extremely high rates, and much higher rates than men, of histories of physical, sexual, and mental trauma. Notwithstanding federal statutory legal protections such as PREA and the Civil Rights of Institutionalized Persons Act, aimed at protecting incarcerated people, many incarcerated women continue to experience physical and psychological safety harms while incarcerated and insufficient satisfaction of their constitutional rights. Department of Justice litigation against prison systems involving sexual abuse among other wrongs has secured important changes to safeguard incarcerated women’s rights. 

Women Offender Case Management Model

The gender-responsive Women Offender Case Management Model (WOCMM) is described. This document covers: the history of the project; philosophy and core practices; process incorporating four core elements (e.g., engage and assess, enhance motivation, implement the case plan, and review progress); preparing for implementation; and evaluation.

Women’s Mass Incarceration: The Whole Pie 2019

With growing public attention to the problem of mass incarceration, people want to know about women’s experience with incarceration. How many women are held in prisons, jails, and other correctional facilities in the United States? And why are they there? How is their experience different from men’s? While these are important questions, finding those answers requires not only disentangling the country’s decentralized and overlapping criminal justice systems, but also unearthing the frustratingly hard to find and often altogether missing data on gender.

This report provides a detailed view of the 231,000 women and girls incarcerated in the United States, and how they fit into the even broader picture of correctional control. We pull together data from a number of government agencies and calculates the breakdown of women held by each correctional system by specific offense. The report, produced in collaboration with the ACLU’s Campaign for Smart Justice, answers the questions of why and where women are locked up.

Working With Incarcerated And Reentering Women: Curricula And Resources For Individual And Group Work

Many researchers and practitioners working with justice-involved women understand the gendered nature of how women end up incarcerated. They also recognize that many (if not most) of the women in these institutions have experienced trauma – either as a child and/or as an adult. Practitioners working with women in jails and prisons also understand that all imprisoned women experience the trauma of incarceration. As a result, advocates, service providers, and others, have created programming for women that is both gender-responsive and trauma-informed. This listing includes resources that give some examples of gender-responsive and trauma-informed programs and curricula for practitioners working with justice-involved women. We include articles that highlight and compare features of some of the emerging models and curricula for groups for women in jails and prisons. Though many of these programs require purchase for licensing, where we could find the curricula or a preview of the curricula online, we included them. Also included are other trauma-related curricula that have been implemented in women’s prisons and/or jails that are not necessarily specifically gender-responsive or trauma-informed, but which we thought could be relevant and helpful to someone interested in starting a group in jail or prison.

Working With Women Who Perpetrate Violence: A Practice Guide

This practice brief was designed to summarize the available research on female perpetrated violence. Information in this area is still quite limited. However, there is a growing body of evidence to suggest that females who engage in violence are not a homogenous group and that there are some important differences in the context and expression of violent behavior across gender. We will examine a host of personal, contextual, cultural, and victimization-related factors among females charged with intimate partner violence and other violent crimes. This information will then be translated into recommendations for assessment and intervention.

World Economic Outlook, October 2019 Global Manufacturing Downturn, Rising Trade Barriers

Global growth is forecast at 3.0 percent for 2019, its lowest level since 2008–09 and a 0.3 percentage point downgrade from the April 2019 World Economic Outlook. Growth is projected to pick up to 3.4 percent in 2020 (a 0.2 percentage point downward revision compared with April), reflecting primarily a projected improvement in economic performance in a number of emerging markets in Latin America, the Middle East, and emerging and developing Europe that are under macroeconomic strain. Yet, with uncertainty about prospects for several of these countries, a projected slowdown in China and the United States, and prominent downside risks, a much more subdued pace of global activity could well materialize. To forestall such an outcome, policies should decisively aim at defusing trade tensions, reinvigorating multilateral cooperation, and providing timely support to economic activity where needed. To strengthen resilience, policymakers should address financial vulnerabilities that pose risks to growth in the medium term. Making growth more inclusive, which is essential for securing better economic prospects for all, should remain an overarching goal.

World Economic Situation and Prospects 2019

The global economy will continue to grow at a steady pace of around 3 percent in 2019 and 2020 amid signs that global growth has peaked. However, a worrisome combination of development challenges could further undermine growth, according to the United Nations World Economic Situation and Prospects (WESP) 2019, which was launched today.

UN Secretary-General António Guterres cautioned “While global economic indicators remain largely favourable, they do not tell the whole story.” He said the World Economic Situation and Prospects 2019 “raises concerns over the sustainability of global economic growth in the face of rising financial, social and environmental challenges.”

Global growth is expected to remain steady at 3.0 per cent in 2019 and 2020, after an expansion of 3.1 per cent in 2018. Growth in the United States is projected to decelerate to 2.5 per cent in 2019 and 2 per cent in 2020, as the impulse from fiscal stimulus in 2018 wanes. Steady growth of 2.0 per cent is projected for the European Union, although risks are tilted to the downside, including a potential fallout from Brexit. Growth in China is expected to moderate from 6.6 per cent in 2018 to 6.3 per cent in 2019, with policy support partly offsetting the negative impact of trade tensions. Several large commodity-exporting countries, such as Brazil, Nigeria and the Russian Federation, are projected to see a moderate pickup in growth in 2019–2020, albeit from a low base.

World Employment and Social Outlook: Trends 2019

This report provides an overview of global and regional trends in employment, unemployment, labour force participation and productivity, as well as employment status, informal employment and working poverty. It also examines income and social developments, and provides an indicator of social unrest.

A key finding is that poor job quality is a prime concern for the most of the global labour force. In addition, unemployment and labour underutilization remain high in many countries, despite improvements in recent years.

The report also takes stock of progress with respect to targets for Sustainable Development Goal 8, which has been slower than anticipated.

World Population Prospects 2019

The United Nations, Department of Economic and Social AffairsPopulation Dynamics offers interactive maps illustrating: population growth rate, total fertility rate, adolescent birth rate, under five mortality, adult mortality both sexes, life expectancy both sexes, life expectancy at age 65 both sexes, percent population 65 and older and potential support ratio.

World Prison Brief data

The World Prison Brief is an online database providing free access to information on prison systems around the world. It is a unique resource, which supports evidence-based development of prison policy and practice globally.

The World Prison Brief is hosted by the Institute for Crime & Justice Policy Research (ICPR), at Birkbeck, University of London. It was launched in 2000 using data compiled by Roy Walmsley, Director of the World Prison Brief.

Worldometers - World population clock

The chart illustrates how world population has changed throughout history. View the full tabulated data.

At the dawn of agriculture, about 8000 B.C., the population of the world was approximately 5 million. Over the 8,000-year period up to 1 A.D. it grew to 200 million (some estimate 300 million or even 600, suggesting how imprecise population estimates of early historical periods can be), with a growth rate of under 0.05% per year.

A tremendous change occurred with the industrial revolution: whereas it had taken all of human history until around 1800 for world population to reach one billion, the second billion was achieved in only 130 years (1930), the third billion in 30 years (1960), the fourth billion in 15 years (1974), and the fifth billion in only 13 years (1987).

  • During the 20th century alone, the population in the world has grown from 1.65 billion to 6 billion.
  • In 1970, there were roughly half as many people in the world as there are now.
  • Because of declining growth rates, it will now take over 200 years to double again.

World’s population is projected to nearly stop growing by the end of the century

For the first time in modern history, the world’s population is expected to virtually stop growing by the end of this century, due in large part to falling global fertility rates, according to a Pew Research Center analysis of new data from the United Nations.

By 2100, the world’s population is projected to reach approximately 10.9 billion, with annual growth of less than 0.1% – a steep decline from the current rate. Between 1950 and today, the world’s population grew between 1% and 2% each year, with the number of people rising from 2.5 billion to more than 7.7 billion.

Youth Confinement: The Whole Pie 2019

On any given day, over 48,000 youth in the United States are confined in facilities away from home as a result of juvenile justice or criminal justice involvement. Most are held in restrictive, correctional-style facilities, and thousands are held without even having had a trial. But even these high figures represent astonishing progress: Since 2000, the number of youth in confinement has fallen by 60%, a trend that shows no sign of slowing down.

What explains these remarkable changes? How are the juvenile justice and adult criminal justice systems different, and how are they similar? Perhaps most importantly, can those working to reduce the number of adults behind bars learn any lessons from the progress made in reducing youth confinement?

This report answers these questions, beginning with a snapshot of how many justice-involved youth are confined, where they are held, under what conditions, and for what offenses. It offers a starting point for people new to the issue to consider the ways that the problems of the criminal justice system are mirrored in the juvenile system: racial disparities, punitive conditions, pretrial detention, and overcriminalization. While acknowledging the philosophical, cultural, and procedural differences between the adult and juvenile justice systems, the report highlights these issues as areas ripe for reform for youth as well as adults.

This updated and expanded version of our original 2018 report also examines the dramatic reduction in the confined youth population, and offers insights and recommendations for advocates and policymakers working to shrink the adult criminal justice system.