CES: Printable & Archival Versions

By default, you are seeing this year's Corrections Environmental Scan. To see previous years' scans, simply enter the year (starting from 2017) that you would like to see, then click the Apply button.

It's also possible to filter the results by choosing options from the Perspective and Type dropdowns. Choosing these options will update the cover image to reflect the choice(s) that were made.

Print Advisory: The cover page background image may not print based on your browser's print settings defaulting to hide background colors and images. For best print results, we suggest using Chrome. The rest of the document will print as designed.

Print

COVID-19 Vaccine Doses - Media Analysis

Prison systems have begun vaccine distribution for incarcerated people. A table of states that publicly report real-time vaccination data is available on our System Report page. For states that are not reporting public numbers, The COVID Prison Project has estimated the amount of incarcerated people and staff that have been vaccinated from media reports. This table is updated on a daily basis.  

1 in 5 Prisoners in the U.S. Has Had COVID-19

One in every five state and federal prisoners in the United States has tested positive for the coronavirus, a rate more than four times as high as the general population. This article examines data collected by The Marshall Project and The Associated Press.

2020 Census Apportionment Results

Apportionment is the process of dividing the 435 memberships, or seats, in the U.S. House of Representatives among the 50 states. At the conclusion of each decennial census, the results are used to calculate the number of seats to which each state is entitled. Each of the 50 states is entitled to a minimum of one seat in the U.S. House of Representatives.

The 2020 Census apportionment population includes the resident population of the 50 states, plus a count of the U.S. military personnel and federal civilian employees living outside the United States (and their dependents living with them) who can be allocated to a home state. The population of the District of Columbia is not included in the apportionment population.

The calculation methods used through most of the 20th century have been based upon the use of a mathematically determined priority listing of states. Adopted by Congress in 1941 and used each census thereafter, the method of equal proportions also results in a listing of the states according to a priority value—calculated by dividing the population of each state by the geometric mean of its current and next seats—that assigns seats 51 through 435.

53% of Americans Say the Internet Has Been Essential During the COVID-19 Outbreak

The coronavirus outbreak has driven many commercial and social activities online and for some the internet has become an ever more crucial link to those they love and the things they need. A new Pew Research Center survey conducted in early April finds that roughly half of U.S. adults (53%) say the internet has been essential for them personally during the pandemic and another 34% describe it as “important, but not essential.”

7 Gallup Workplace Insights: What We Learned in 2020

2020 will likely be remembered as the year the workplace changed forever. From in-office safety measures to work-from-home conference calls, leaders have been forced to reimagine every aspect of their management culture.

What's essential to performance? How does personal life shape professional life? What do our core values really mean when the marketplace throws a curveball?

As leaders navigated 2020's tough questions, many made transformative discoveries and tapped into new performance potential. After 12 months of challenges, leaders can walk away with decades' worth of invaluable workplace lessons.

A Crisis Like No Other, An Uncertain Recovery

Global growth is projected at –4.9 percent in 2020, 1.9 percentage points below the April 2020 World Economic Outlook (WEO) forecast. The COVID-19 pandemic has had a more negative impact on activity in the first half of 2020 than anticipated, and the recovery is projected to be more gradual than previously forecast. In 2021 global growth is projected at 5.4 percent. Overall, this would leave 2021 GDP some 6½ percentage points lower than in the pre-COVID-19 projections of January 2020. The adverse impact on low-income households is particularly acute, imperiling the significant progress made in reducing extreme poverty in the world since the 1990s.

As with the April 2020 WEO projections, there is a higher-than-usual degree of uncertainty around this forecast. The baseline projection rests on key assumptions about the fallout from the pandemic. In economies with declining infection rates, the slower recovery path in the updated forecast reflects persistent social distancing into the second half of 2020; greater scarring (damage to supply potential) from the larger-than-anticipated hit to activity during the lockdown in the first and second quarters of 2020; and a hit to productivity as surviving businesses ramp up necessary workplace safety and hygiene practices. For economies struggling to control infection rates, a lengthier lockdown will inflict an additional toll on activity. Moreover, the forecast assumes that financial conditions—which have eased following the release of the April 2020 WEO—will remain broadly at current levels. Alternative outcomes to those in the baseline are clearly possible, and not just because of how the pandemic is evolving. The extent of the recent rebound in financial market sentiment appears disconnected from shifts in underlying economic prospects—as the June 2020 Global Financial Stability Report (GFSR) Update discusses—raising the possibility that financial conditions may tighten more than assumed in the baseline.

A Majority of Young Adults in the U.S. Live With Their Parents For the First Time Since the Great Depression

The coronavirus outbreak has pushed millions of Americans, especially young adults, to move in with family members. The share of 18- to 29-year-olds living with their parents has become a majority since U.S. coronavirus cases began spreading early this year, surpassing the previous peak during the Great Depression era.

In July, 52% of young adults resided with one or both of their parents, up from 47% in February, according to a new Pew Research Center analysis of monthly Census Bureau data. The number living with parents grew to 26.6 million, an increase of 2.6 million from February. The number and share of young adults living with their parents grew across the board for all major racial and ethnic groups, men and women, and metropolitan and rural residents, as well as in all four main census regions. Growth was sharpest for the youngest adults (ages 18 to 24) and for White young adults.

A State-By-State Look at 15 Months of Coronavirus in Prisons

In March 2020, at the beginning of the coronavirus pandemic in the United States, The Marshall Project began to track how many people contracted COVID-19 in federal and state prisons across the country. For more than a year, working with The Associated Press, the numbers were updated every week. Download the raw data on Github and Data.world, and read more about other sources for current data and how they collected their numbers.

About Half of Lower-Income Americans Report Household Job or Wage Loss Due to COVID-19

Pew Research Center conducted this study to understand Americans’ assessments of their personal financial situation during the current period of economic slowdown and high unemployment rates caused by the coronavirus outbreak. For this analysis, they surveyed 4,917 U.S. adults in April 2020. Everyone who took part is a member of Pew Research Center’s American Trends Panel (ATP), an online survey panel that is recruited through national, random sampling of residential addresses.

Advancing Technological Equity for Incarcerated College Students

Higher education programs that teach in prisons take on a near impossible task: to provide their students with a high-quality education, equal to anything beyond the prison walls, while working under strict constraints. Incarcerated students rarely have access to learning resources typically taken for granted on the outside—computers, books, and internet access are all heavily restricted by various state Departments of Corrections (DOC)—and instructors must work with and around DOC security protocols while planning and teaching their classes.

There is now growing support for prison reform and prison education programming. In 2016, the Obama administration undertook a pilot, called Second Chance Pell, which aimed to test the restoration of Pell funding for incarcerated students who had been deprived of eligibility by the 1994 Omnibus Crime Bill. Full restoration of Pell funding for the incarcerated population is currently under consideration, and while this represents a tremendous opportunity, there is an equally pressing need to understand how to best serve this particular student population.  As access to information and technology resources is critical to supporting student success, Ithaka S+R has undertaken a qualitative research project to better understand the current landscape and potential opportunities of technology and information resources in postsecondary prison education.

Americans Lost More Years of Life to COVID-19 in 2020 Than to All Accidents Combined in a Typical Year

About 600,000 Americans have died of COVID-19 since the coronavirus outbreak began. But behind that huge figure is a more nuanced one that brings the human toll of the virus into even sharper relief.

In addition to the overall number of deaths from a given cause, researchers can estimate the number of “life years” lost due to it – a statistic that takes life expectancy into account. For example, if a person with a life expectancy of 80 dies at age 50, they are estimated to have lost 30 years of life. Examining this statistic underscores the extent to which the virus has cut Americans’ lives short.

In 2020 alone, the coronavirus was responsible for about 380,000 deaths and roughly 5.5 million years of lost life in the United States, according to a Pew Research Center analysis of provisional data from the Centers for Disease Control and Prevention. That number of life years lost is more than the number lost in a typical calendar year to all accidents combined – including traffic accidents, drownings, firearm accidents, drug overdoses and other poisonings – and more than triple the number of life years lost in a normal calendar year due to liver disease or diabetes.

Amid Coronavirus Outbreak, Nearly Three-in-Ten Young People Are Neither Working Nor in School

As COVID-19 cases have surged in the United States, young adults face a weakening labor market and an uncertain educational outlook. Between February and June 2020, the share of young adults who are neither enrolled in school nor employed – a measure some refer to as the “disconnection rate” – has more than doubled, according to a new analysis of Census Bureau data by Pew Research Center. Most of the increase is related to job loss among young workers.

At the beginning of 2020, the share of Americans ages 16 to 24 who were “disconnected” from work and school mirrored rates from the previous year. But between March and April, the share jumped significantly, from 12% to 20%. By June 2020, 28% of youths were neither in school nor the workplace.

While not the highest on record, June’s 28% disconnection rate – which translates into 10.3 million young people – is the highest ever observed for the month of June, dating back to 1989 when the data first became available. This trend is one indicator of the difficulties young people are facing as they transition into adulthood during a global pandemic.

Annual Survey of State Government Finances Summary: 2019

In 2019, state government revenues decreased 1.7 percent from the 2018 estimate of $2.71 trillion to $2.66 trillion. The major shares of revenue for state governments were taxes (40.6 percent), intergovernmental (26.6 percent), and insurance trust revenue (16.4 percent).

Black Imprisonment Rate In the U.S. Has Fallen By a Third Since 2006

The nation’s imprisonment rate is at its lowest level in more than two decades. The greatest decline has come among black Americans, whose imprisonment rate has decreased 34% since 2006.

There were 1,501 black prisoners for every 100,000 black adults at the end of 2018, according to a new report from the Bureau of Justice Statistics (BJS), the statistical agency of the U.S. Justice Department. That was down sharply from 2,261 black inmates per 100,000 black adults at the end of 2006, according to an earlier BJS study. These statistics only count inmates sentenced to more than a year in state or federal prison. They exclude inmates held in local jails and those sentenced to shorter periods of imprisonment.

Imprisonment rates have also declined for the two other major racial or ethnic groups tracked by BJS – Hispanic and white Americans – though not as much as among blacks. Between 2006 and 2018, the imprisonment rate fell 26% among Hispanics and 17% among whites.

Challenges and Opportunities in the Post-COVID-19 World

While a global pandemic has been a looming risk for decades, COVID-19 has come as a shock to society, health systems, economies and governments worldwide. In the midst of extraordinary challenges and uncertainty, and countless personal tragedies, leaders are under pressure to make decisions on managing the immediate impact of the pandemic and its consequences, decisions that will shape the state of the world for years to come. What might be the silver linings in the crisis and how might leaders use this moment to build a more prosperous, equitable and sustainable world? In this collection of essays, the Global Risks Advisory Board of the World Economic Forum’s Global Risks Initiative looks beyond the current crisis to the potential challenges and opportunities in the post-COVID-19 world. The result is a range of expert opinions from a geographically diverse set of leaders. They are designed to offer new perspectives on the post-pandemic future, in support of efforts to proactively and collectively shape the future we want. The views represented are solely those of the authors and do not represent the views of the World Economic Forum. 

Clocking in Amid Coronavirus: How the Workforce Has Changed

How have U.S. workers handled disruptions from the coronavirus outbreak? And how have key measures like employee engagement and wellbeing fared? Jim Harter, Gallup's Chief Scientist on Workplace and Wellbeing, joins the podcast to break down Gallup's latest findings.

Coronavirus (COVID-19) Deaths

This webpage has many interactive charts. Each chart can be customized using the COVID-19 dataset and downloaded. The data on confirmed cases and deaths are from Johns Hopkins University (JHU).

Correctional Populations in the United States, 2017-2018

This report is the 23rd in a series that began in 1985. It provides statistics on populations supervised by adult correctional systems in the United States, including persons held in prisons or jails and those supervised in the community on probation or parole. It provides statistics on the size of the correctional populations at year-end 2017 and year-end 2018, and changes in populations over time.

Highlights
  • The adult correctional-supervision rate (adults supervised per 100,000 adult U.S. residents) decreased 21% from 2008 to 2018, from 3,160 to 2,510 per 100,000 adult U.S. residents.
  • The percentage of adult U.S. residents under correctional supervision was lower in 2018 than at any time since 1992.
  • The adult incarceration rate (adults in prison or jail per 100,000 adult U.S. residents) has declined every year since 2008, and the rate in 2018 was the lowest since 1996.
  • The portion of adult U.S. residents in prison or jails fell 17% from 2008 to 2018.
  • The correctional population declined 2.1% from 2017 to 2018, due to decreases in both the community-supervision (down 2.4%) and incarcerated (down 1.4%) populations.

Court Appearances in Criminal Proceedings Through Telepresence

Local jurisdictions, faced with caseloads of increasing complexity and cost, have adopted alternative approaches to criminal case processing — including the use of new technologies — that have the potential to reduce backlog and improve judicial efficiency. Telepresence technology, which allows an individual or group of individuals to appear in a court proceeding from a remote location, is one example of such a technology. On behalf of the National Institute of Justice, RTI International and the RAND Corporation convened the Court Appearances Through Telepresence Advisory Workshop in November 2018 as part of the Priority Criminal Justice Needs Initiative. The telepresence workshop was designed to explore the potential benefits and burdens of telepresence technology and identify innovative solutions for addressing concerns regarding the use of these technologies for criminal court appearances. Participants acknowledged the potential benefits of telepresence technology in expediting pretrial and trial case processing; providing cost savings; and expanding the ability of victims, witnesses, language interpreters, and other individuals to participate. However, the panel members also discussed the potential disadvantages of telepresence technology, which can result in a violation of the defendant's constitutional rights or increase the risk of an unfavorable outcome. Participants also expressed the need for detailed technical standards and stakeholder-specific trainings that ensure the proper setup and high-quality multipurpose use of telepresence technology in court. Given the complexity of the issues involved, the participants emphasized the need to enable state and local courts to handle data collection and storage in a manner that preserves the trial record.

COVID-19 and Pretrial Practices: A Judicial Roundtable

The Judicial Roundtables, convened on June 16 and July 9, 2020, explored how court operations have changed in the participating jurisdictions as a result of COVID-19, the impact of those changes thus far, and the potential long-term impacts of these short-term changes.

COVID-19 and Pretrial Practices: A Pretrial Executives Roundtable

The Pretrial Executives Roundtables, convened on June 19 and July 16, 2020, explored how pretrial practices have changed in the participating jurisdictions as a result of COVID-19, the impact of those changes thus far, and the potential long-term impacts of these short-term changes

COVID-19 Criminal Justice Responses to the Coronavirus Pandemic

The coronavirus, or COVID-19, has been declared by the World Health Organization to be a global pandemic. As the number of people infected in the United States grows exponentially, we must focus on prevention and containment in the criminal and immigration legal systems. Vera and Community Oriented Correctional Health Services have created a series of fact sheets to guide actors in these systems, who have a unique and critical role to play.

Demographic Turning Points for the United States: Population Projections for 2020 to 2060

The year 2030 marks a demographic turning point for the United States. Beginning that year, all baby boomers will be older than 65 years of age. This will expand the size of the older population so that one in every five Americans is projected to be of retirement age. Later that decade, by 2034, we project that older adults will outnumber children for the first time in U.S. history. The year 2030 marks another demographic first for the United States. That year, because of population aging, immigration is projected to overtake natural increase (the excess of births over deaths) as the primary driver of population growth for the country.
 
Beyond 2030, the U.S. population is projected to grow slowly, age considerably, and become more racially and ethnically diverse. Despite slowing population growth, particularly after 2030, the U.S. population is still expected to grow by 79 million people by 2060, crossing the 400 million threshold in 2058.
 
This report discusses projected changes in the U.S. population and summarizes results from the U.S. Census Bureau’s 2017 National Population Projections. It focuses on 2030 as a demographic turning point for the United States, but explores broader changes in the age, race, and ethnic composition of the population from 2020 to 2060.

Early Impacts of the COVID-19 Pandemic: Findings from the 2020 Guttmacher Survey of Reproductive Health Experiences

In this report, the Guttmacher Institute examines new data collected from cisgender women in the United States on how they feel that the COVID-19 pandemic has influenced their sexual reproductive health. It also examines women’s reports of pandemic-related economic challenges and how these challenges intersect with their sexual and reproductive experiences. Across these analyses,particular attention is given to longstanding social and economic inequities experienced by women based on their race, ethnicity, sexual orientation or income level. To understand the scope and magnitude of these initial impacts of the COVID 19 crisis, the Guttmacher Institute compare them directly with the sexual reproductive health challenges observed as part of the social and economic instability following the 2008 Great Recession. 

Economic Fallout From COVID-19 Continues To Hit Lower-Income Americans the Hardest

Pew Research Center conducted this study to understand Americans’ assessments of their personal financial situation during the current period of economic slowdown and high unemployment rates caused by the coronavirus outbreak. For this analysis, they surveyed 13,200 U.S. adults in August 2020. Everyone who took part is a member of Pew Research Center’s American Trends Panel (ATP), an online survey panel that is recruited through national, random sampling of residential addresses.

Emerging Pathways towards a Post-COVID-19 Reset and Recovery

The COVID-19 crisis and the political, economic and social disruptions it has caused have exposed the inadequacies of our current economic systems. Amid global concern for lives, livelihoods and the planet, leaders find themselves at a historic crossroads for shaping the recovery, and have a window of opportunity to reset economies on a new trajectory of more inclusive and sustainable growth. Following a brief review of the most recent developments, this edition of the World Economic Forum Chief Economists Outlook sets out a highlevel agenda for a path forward on three key emerging challenges: retooling economic policy to reduce inequality and improve social mobility; identifying new sources of economic growth; and aligning on new targets for economic performance. As the contours of the global economic environment evolve, upcoming editions of the Chief Economists Outlook will continue to explore forward-looking topics, including an in-depth look at the themes covered in this publication.

Experience to Action Reshaping Criminal Justice After COVID-19

This report provides criminal justice policymakers and practitioners with a priority agenda to prepare the nation’s criminal justice system for future public health crises. Through its recommendations, the Commission seeks to better balance the roles and responsibilities of the public health and public safety fields.

Experts Predict More Digital Innovation by 2030 Aimed at Enhancing Democracy

A large share of experts and analysts worry that people’s technology use will mostly weaken core aspects of democracy and democratic representation in the coming decade. Yet they also foresee significant social and civic innovation between now and 2030 to try to address emerging issues.

In this new report, technology experts who shared serious concerns for democracy in a recent Pew Research Center canvassing weigh in with their views about the likely changes and reforms that might occur in the coming years.

Fewer Jobs Have Been Lost In the EU Than In the U.S. During the COVID-19 Downturn

The European Union and the United States have both been deeply affected by the coronavirus outbreak. The two contribute equally to the world economy, each accounting for about 16% of global output. A key difference is that the EU is home to about 100 million more people than the U.S. But Americans have lost significantly more jobs than their EU counterparts during the COVID-19 downturn.

One factor in play is that while countries across the EU deployed significant employment retention schemes, the U.S. focused on stimulus checks and unemployment compensation in lieu of job retention.

Roughly 9.6 million U.S. workers (ages 16 to 64) lost their jobs, based on averages of the first three quarters of 2019 and the first three quarters of 2020. In contrast, only about 2.6 million workers in the EU (ages 15 to 64) lost their jobs over this period, despite having a larger population. Young adults in both regions were more likely to lose jobs during the pandemic, according to a new Pew Research Center analysis of U.S. government and Eurostat data.

Global Competitiveness Report: How Countries are Performing on the Road to Recovery

The Global Competitiveness Report series has since its first edition aimed to prompt policy-makers beyond short term growth and to aim for long-run prosperity. The 2020 special edition is dedicated to elaborating on the priorities for recovery and revival, and considering the building blocks of a transformation towards new economic systems that combine “productivity”, “people” and “planet” targets.

The 2020 special edition of The Global Competitiveness Report (GCR) series comes out at a very difficult and uncertain historical moment. The outbreak of the COVID-19 pandemic has not only led to a global health crisis and deep economic recession—deeper than the downturn during the 2008–2009 financial crisis—but has also created a climate of profound uncertainty about the future outlook

Global Economic Prospects: Slow Growth, Policy Challenges

Following its weakest performance since the global financial crisis, the world economy is poised for a modest rebound this year– if everything goes just right.

Hanging over this lethargic recovery are two other trends that raise questions about the course of economic growth: the unprecedented runup in debt worldwide, and the prolonged deceleration of productivity growth, which needs to pick up to bolster standards of living and poverty eradication.

Global growth is set to rise by 2.5% this year, a small uptick from 2.4% in 2019, as trade and investment gradually recover, the World Bank’s semi-annual Global Economic Prospects forecasts. Advanced economies are expected to slow as a group to 1.4% from 1.6%, mainly reflecting lingering weakness in manufacturing. 

Emerging market and developing economies will see growth accelerate to 4.1% from 3.5% last year. However, the pickup is anticipated to come largely from a small number of large emerging economies shaking off economic doldrums or stabilizing after recession or turbulence.  For many other economies, growth is on track to decelerate as exports and investment remain weak.

A worrying aspect of the sluggish growth trend is that even if the recovery in emerging and developing economy growth takes place as expected, per capita growth will remain below long-term averages and will advance at a pace too slow to meet poverty eradication goals. Income growth would in fact be slowest in Sub-Saharan Africa – the region where 56 percent of the world’s poor live. 

Global Financial Stability Report: Bridge to Recovery

Near-term global financial stability risks have been contained as an unprecedented policy response to the coronavirus (COVID-19) pandemic has helped avert a financial meltdown and maintain the flow of credit to the economy. For the first time, many emerging market central banks have launched asset purchase programs to support the smooth functioning of financial markets and the overall economy. But the outlook remains highly uncertain, and vulnerabilities are rising, representing potential headwinds to recovery. The report presents an assessment of the real-financial disconnect, as well as forward-looking analysis of nonfinancial firms, banks, and emerging market capital flows. After the outbreak, firms’ cash flows were adversely affected as economic activity declined sharply. More vulnerable firms—those with weaker solvency and liquidity positions and smaller size—experienced greater financial stress than their peers in the early stages of the crisis. As the crisis unfolds, corporate liquidity pressures may morph into insolvencies, especially if the recovery is delayed. Small and medium-sized enterprises (SMEs) are more vulnerable than large firms with access to capital markets. Although the global banking system is well capitalized, some banking systems may experience capital shortfalls in an adverse scenario, even with the currently deployed policy measures. The report also assesses the pandemic’s impact on firms’ environmental performance to gauge the extent to which the crisis may result in a reversal of the gains posted in recent years.

Global Migration, By the Numbers: Who Migrates, Where They Go and Why

  • There are an estimated 272 million international migrants – 3.5% of the world’s population.
  • While most people leave their home countries for work, millions have been driven away due to conflict, violence and climate change.
  • Most migrants come from India; the United States is the primary destination.

There are an estimated 272 million international migrants around the world. And while that equals just 3.5% of the world’s population, it already surpasses some projections for 2050. Since 1970, the number of people living in a country other than where they were born has tripled.

The scale and speed of migration – defined by the International Organization for Migration (IOM) as the movement of persons away from their place of usual residence, either across an international border or within a state – is notoriously difficult to predict given it can go hand in hand with events such as severe instability, economic crisis or conflict.

Gross Domestic Product by State, 4th Quarter 2020 and Annual 2020 (Preliminary)

Real gross domestic product (GDP) increased in all 50 states and the District of Columbia in the fourth quarter of 2020, as real GDP for the nation increased at an annual rate of 4.3 percent, according to statistics released by the U.S. Bureau of Economic Analysis. The percent change in real GDP in the fourth quarter ranged from 9.9 percent in South Dakota to 1.2 percent in the District of Columbia (table 1).

Growth of International Migration Slowed By 27%, or 2 Million Migrants, Due to COVID-19

COVID-19 has disrupted all forms of human mobility through the closing of national borders and halting of travel worldwide. Preliminary estimates suggest that the pandemic may have slowed the growth in the stock of international migrants by around two million by mid-2020, 27 percent less than the growth expected since mid-2019, according to a report by the United Nations.

Growth in the number of international migrants has been robust over the last two decades, reaching 281 million people living outside their country of origin in 2020, up from 173 million in 2000 and 221 million in 2010.  Currently, international migrants represent about 3.6 per cent of the world’s population.

How COVID-19 in Jails and Prisons Threatens Nearby Communities

Two new studies show that jails can contribute enormously to coronavirus case totals outside their walls. While COVID-19’s spread inside the facilities has been widely reported, the research demonstrates just how great an impact it can have in communities outside.

How Does the Public Health Workforce Compare with the Broader Public Sector?

The state and local governmental public health workforce plays a critical role in protecting and improving the lives of the individuals it serves. As is the case with state and local employment generally, the workforce in public health is changing. Recruitment and retention of the next wave of employees presents challenges, particularly at a time of continued retirements, low unemployment, and competition from the private sector for talented graduates and other career entrants. To better understand the U.S. public health workforce, this primer describes its current size, expectations for growth, employee demographics, job tenure, and the skill sets most in demand. This description is offered against the broader backdrop of the overall state and local government sector. This briefing comes from a Center for State and Local Government Excellence (SLGE) analysis of the most recent Public Health Workforce Interests and Needs Survey (PH WINS 2017), along with data sets from the 2017 U.S. Census Bureau, the U.S. Department of Labor - Bureau of Labor Statistics, and the SLGE workforce survey (unless otherwise noted). 

How Many People Have Ever Lived on Earth?

Given a current global population of about 7.8 billion, the revised estimate means those alive in 2020 represent nearly 7% of the total number of people who have ever lived.

Calculating the answer to the question “How many people have ever lived on Earth?” is complicated. To begin with, when we initially wrote this article back in 1995, “modern” Homo sapiens (that is, people who were roughly like we are now) were thought to have first walked the Earth around 50,000 B.C.E. Discoveries now suggest modern Homo sapiens existed much earlier, around 200,000 B.C.E. This major change in our understanding of human existence spurred new calculations and consultations with experts, resulting in an estimate that about 117 billion members of our species have ever been born on Earth.

How did we reach this number? Dudley Poston Jr., a prominent demographer at Texas A&M University, extended our original analysis to 190,000 B.C.E. and produced an estimate of around 8 billion births between 190,000 B.C.E. and 50,000 B.C.E. Taking Poston’s number into account, we came to our revised estimate of 117 billion people born since 190,000 B.C.E. We also estimate that by 2050 another 4 billion births will increase the number of people who have ever lived on Earth to about 121 billion.

To be sure, calculating the number of people who have ever lived is part science and part art. No demographic data exist for more than 99% of the span of human existence. Still, with some assumptions about population size throughout human history, we can get a rough idea of this number.

How the Coronavirus Outbreak Has – and Hasn’t – Changed the Way Americans Work

Pew Research Center conducted this study to better understand how the work experiences of employed adults have changed amid the coronavirus outbreak. This analysis is based on 5,858 U.S. adults who are working part time or full time and who have only one job or have more than one job but consider one of them to be their primary job. The data was collected as a part of a larger survey conducted Oct. 13-19, 2020. Everyone who took part is a member of the Center’s American Trends Panel (ATP), an online survey panel that is recruited through national, random sampling of residential addresses.

How to Protect Essential Workers During COVID-19

Even with COVID-19 requiring social distancing for the weeks or months to come, the United States still requires an enormous class of workers to keep essential services online. The Department of Homeland Security uses a sweeping definition of such essential industries, which collectively employed anywhere from 49 to 62 million workers prior to the COVID-19 outbreak according to our highest estimates. Many of these essential industries will see continued demand for their products and services, the inverse of other industries that cannot operate during a period of social distancing.

A portion of these essential workers will continue to report to their jobs at health care facilities, grocery stores, water utilities, and other work sites—all to ensure the rest of the country can maintain some semblance of a typical life during this health crisis. Yet many of the same workers were already at an economic disadvantage—generally earning lower wages and carrying less health-related insurance—before the crisis hit. In other words, it’s not just the total number of jobs that matters, but a better understanding of who these workers are and the risks they face.

Impact of COVID-19 on the Local Jail Population, January-June 2020

Local jails in the United States experienced a large decline in their inmate populations from June 30, 2019 to June 30, 2020, which can be attributed mainly to the COVID-19 pandemic. The inmate population confined in local jails was 549,100 at the end of June 2020, down from 734,500 at the end of June 2019. The midyear 2020 inmate population was the lowest since 1996, when 518,500 inmates were confined in local jails (not shown in tables).

The impact of COVID-19 on local jails began in March 2020, with a drop of 18% in the inmate population between the end of February and the end of March, followed by an 11% drop by the end of April. By the last weekday in April 2020, the number of jail inmates dropped to a low of 519,500. By the end of May 2020, the population increased about 3% and was up another 2% by the end of June 2020.


International Migration 2020 Highlights

In 2020, the COVID-19 pandemic affected drastically all forms of human mobility, including international migration. Around the globe, the closing of national borders and severe disruptions to international travel obliged hundreds of thousands of people to cancel or delay plans of moving abroad. Hundreds of thousands of migrants were stranded, unable to return to their countries, while others were forced to return to their home countries earlier than planned, when job opportunities dried up and schools closed. While it is too soon to understand the full extent of the impact of the pandemic on migration trends, the present Highlights indicate that the disruptions caused by the COVID-19 pandemic may have reduced the number of international migrants by around 2 million globally by mid-2020, corresponding to a decrease of around 27 per cent in the growth expected from July 2019 to June 2020.

Prior to the disruptions to migration flows caused by the COVID-19 pandemic in 2020, the number of international migrants had grown robustly over the past two decades. It is estimated that the number of persons living outside of their country of origin reached 281 million in 2020, roughly equal to the size of the entire population of Indonesia, the world’s fourth most populous country. Between 2000 and 2010, the number of international migrants increased by 48 million globally, with another 60 million added between 2010 and 2020. Much of this increase was due to labour or family migration. Humanitarian crises in many parts of the world also contributed, with an increase of 17 million in the number of refugees and asylum seekers between 2000 and 2020. In 2020, the number of persons forcibly displaced across national borders worldwide stood at 34 million, double the number in 2000. 

Jail Inmates in 2018

This report is the 32nd in a series that began in 1982. It provides statistics based on BJS's Annual Survey of Jails and Census of Jail Inmates. It describes the number of inmates held in local jails, jail incarceration rates, demographic characteristics of jail inmates, number of admissions to jail, jail capacity, inmate turnover rates, and staff employed in local jails.

Highlights
  • The jail incarceration rate decreased 12% from 2008 to 2018, from 258 to 226 inmates per 100,000 U.S. residents.
  • In 2018, jails reported 10.7 million admissions, a 21% decline from 2008.
  • In 2018, more than two-thirds (68%) of jail inmates were held for felony charges.
  • The male jail inmate population decreased 9% from 2008 to 2018, while the female inmate population increased 15%.
  • From 2008 to 2018, the jail incarceration rate increased by 12% for whites and decreased by about 30% for blacks (28%) and Hispanics (33%).

Key Findings About U.S. Immigrants

The United States has more immigrants than any other country in the world. Today, more than 40 million people living in the U.S. were born in another country, accounting for about one-fifth of the world’s migrants. The population of immigrants is also very diverse, with just about every country in the world represented among U.S. immigrants.

Pew Research Center regularly publishes statistical portraits of the nation’s foreign-born population, which include historical trends since 1960. Based on these portraits, here are answers to some key questions about the U.S. immigrant population.

How many people in the U.S. are immigrants?

The U.S. foreign-born population reached a record 44.8 million in 2018. Since 1965, when U.S. immigration laws replaced a national quota system, the number of immigrants living in the U.S. has more than quadrupled. Immigrants today account for 13.7% of the U.S. population, nearly triple the share (4.8%) in 1970. However, today’s immigrant share remains below the record 14.8% share in 1890, when 9.2 million immigrants lived in the U.S.

Living Longer: Historical and Projected Life Expectancy in the United States, 1960 to 2060

Throughout this report, we use the U.S. Census Bureau’s 2017 National Population Projections to examine potential mortality and life expectancy changes in the coming decades. To provide historical context, we draw extensively on life expectancy data from the National Center for Health Statistics (NCHS). The report includes projections of life expectancy from 2017 to 2060 and explores projected differences in mortality for men and women and for different race and Hispanic origin groups in the United States. The report also focuses on projected life expectancy dif-ferences between the native-born and foreign-born populations. The mortality projections covered in this report are based on the first nativity-specific life ables and life expectancies to be published by the Census Bureau.

Many Tech Experts Say Digital Disruption Will Hurt Democracy

The years of almost unfettered enthusiasm about the benefits of the internet have been followed by a period of techlash as users worry about the actors who exploit the speed, reach and complexity of the internet for harmful purposes. Over the past four years – a time of the Brexit decision in the United Kingdom, the American presidential election and a variety of other elections – the digital disruption of democracy has been a leading concern.

In light of this furor, Pew Research Center and Elon University’s Imagining the Internet Center canvassed technology experts in the summer of 2019 to gain their insights about the potential future effects of people’s use of technology on democracy. Overall, 979 technology innovators, developers, business and policy leaders, researchers, and activists responded to the query. This article examines those responses.

Mass Incarceration: The Whole Pie 2020

Can it really be true that most people in jail are being held before trial? And how much of mass incarceration is a result of the war on drugs? These questions are harder to answer than you might think, because our country’s systems of confinement are so fragmented. The various government agencies involved in the justice system collect a lot of critical data, but it is not designed to help policymakers or the public understand what’s going on. As public support for criminal justice reform continues to build, however, it’s more important than ever that we get the facts straight and understand the big picture.

The American criminal justice system holds almost 2.3 million people in 1,833 state prisons, 110 federal prisons, 1,772 juvenile correctional facilities, 3,134 local jails, 218 immigration detention facilities, and 80 Indian Country jails as well as in military prisons, civil commitment centers, state psychiatric hospitals, and prisons in the U.S. territories. This report provides a detailed look at where and why people are locked up in the U.S..

Millennial State & Local Government Employee Views on Their Jobs, Compensation & Retirement

In 2016, Millennials became the largest generation in the U.S. labor force. More than one in three participants in the workforce are Millennials, born between 1980 and 1995. As of 2017, 56 million Millennials in the U.S. were working or seeking employment, surpassing Generation X and Baby Boomers. Millennials are employed in both the public and private sectors. According to the U.S. Bureau of Labor Statistics, more than 22.5 million U.S. workers are government employees. As of December 2019, 2.8 million workers serve at the federal level, 5.1 million are at the state level, and 14.6 million work for local government. In 2019, 32 percent of state and local employees were Millennials. Against this backdrop, the National Institute on Retirement Security (NIRS) commissioned a national public opinion survey to develop a deep understanding of the views of state and local public employees regarding their jobs, pay and benefits. Released in November 2019, State and Local Employee Views on Their Jobs, Pay and Benefits found that retirement and healthcare benefits are critically important job features for state and local employees, more so than salary. It also found that these benefits are viewed as a powerful recruitment and retention tool, with nearly all state and local workers (93 percent) saying that pensions incentivize public workers to have long public service careers, and 94 percent agreeing that a pension is a good tool for both attracting and retaining employees. This issue brief provides a deeper analysis of the November 2019 NIRS research, drilling down to examine the views of Millennials working in state and local government.

Most Americans Consider Themselves Middle-Class. But Are They?

Chances are that you believe you are in the middle class—nearly everyone in the United States does. Doctors and lawyers believe they are middle-class; so, too, do welders and waiters. In a 2015 Pew survey, only 10 percent of Americans said they considered themselves lower-class and just 1 percent thought they were upper-class.

Earnings have been flat or stagnant for many middle-class workers in the United States while health care, education, and housing costs are rising. Surveys show that Americans accurately perceive these pressures too and share a broad belief that the middle class is struggling. Seven in ten respondents to a Northwestern Mutual survey said that the middle class was staying the same or shrinking. One-third said the middle class might disappear entirely.

Occupational Employment and Wages, May 2020: Correctional Officers and Jailers

This Bureau of Labor Statistics page provides information on correctional officers and jailers. The duties of this job category include guarding inmates in penal or rehabilitative institutions in accordance with established regulations and procedures. Correctional officers and jailers may guard prisoners in transit between jail, courtroom, prison, or other points. It includes deputy sheriffs and police who spend the majority of their time guarding prisoners in correctional institutions.

Occupational Employment and Wages, May 2020: First-Line Supervisors of Correctional Officer

This Bureau of Labor Statistics page provides information on the industry profiles of first-line supervisors of correctional officers who directly supervise and coordinate activities of correctional officers and jailers. Industries with the highest published employment and wages for first-line supervisors of correctional officers are also provided.


Occupational Employment and Wages, May 2020: Police and Sheriff's Patrol Officers

This Bureau of Labor Statistics page provides information on how police and sheriff's patrol officers maintain order and protect life and property by enforcing local, tribal, state, or federal laws and ordinances. They perform a combination of the following duties: patrol a specific area; direct traffic; issue traffic summonses; investigate accidents; apprehend and arrest suspects, or serve legal processes of courts. This occupation includes police officers working at educational institutions.

Occupational Employment and Wages, May 2020: Probation Officers and Correctional Treatment Specialists

This Bureau of Labor Statistics page provides information on how probation officers and correctional treatment specialists provide social services to assist in the rehabilitation of offenders in custody or on probation or parole. They make recommendations for actions involving formulation of a rehabilitation plan and treatment of an offender, including conditional release and education and employment stipulations.

Pandemic-Driven Declines in Tourism Take Toll on Many States' Revenues

Nationally, leisure and hospitality jobs have endured by far the largest losses of any major industry. A review of U.S. Department of Labor jobs data for August, however, shows vast differences in how the industry has held up across states. Seven had incurred sharp reductions of a third or more from February’s pre-pandemic employment totals. A few others, meanwhile, had largely recovered from an initial wave of layoffs and were down less than 10%. For areas that lean heavily on tourism and hospitality, how the industry recovers matters not only for regional economies, but also for the vital tax dollars generated to fund state and local government budgets.

People in Jail and Prison in 2020

Vera Institute of Justice researchers collected data on the number of people in local jails and state and federal prisons at both midyear and fall 2020 to provide timely information on how incarceration is changing in the United States during the COVID-19 pandemic. Researchers estimated the national jail population using a sample of 1,558 jail jurisdictions and the national prison population based on a sample of 49 states and the Federal Bureau of Prisons. Vera also collected data on people incarcerated and detained by the U.S. Marshals Service (USMS) and Immigration and Customs Enforcement (ICE).

Prisoners in 2019

This report is the 94th in a series that began in 1926. It provides counts of prisoners under the jurisdiction of state and federal correctional authorities in 2019 and includes findings on admissions, releases, and imprisonment rates. It describes demographic and offense characteristics of state and federal prisoners.

Highlights
  • The number of prisoners under state or federal jurisdiction decreased by an estimated 33,600 (down 2%) from 2018 to 2019, and by 184,700 (down 11%) since 2009, the year that the number of prisoners peaked in the United States.
  • In 2019, the imprisonment rate fell for the 11th consecutive year, hitting its lowest point since 1995.
  • The imprisonment rate fell 3% from 2018 to 2019, and 17% from 2009 to 2019.
  • From 2009 to 2019, the total imprisonment rate fell 29% among black residents, 24% among Hispanic residents, and 12% among white residents.

Prisons and Penny-Pinching: Finding Budget Savings in the Time of COVID-19

Having a global pandemic steamroll its way through a state’s economy is no one’s good idea of enacting budgetary restraints. But facing reality is not optional. Texas has faced budget tightening in its corrections system before. So, legislators must address this situation in a similar fashion— by once again prioritizing finite resources while, this time, seeking to get a handle on a costly, aging prison population and reducing technical violations that undermine the entire purpose of community supervision in the first place.


Probation and Parole in the United States, 2017-2018

This report is the 27th in a series that began in 1980. It provides national data on the adult population on probation or parole in 2017 and 2018. It describes trends in the overall community-supervision population and annual changes in probation and parole populations.

Highlights
  • In the United States, the adult population on probation or parole declined from 4,508,900 at the end of 2017 to 4,399,000 at the end of 2018, a decrease of 2.4%.
  • The total community-supervision population in 2018 was at its lowest level since 1998.
  • The portion of adults on community supervision fell 1.5% from 2016 to 2017, 3% from 2017 to 2018, and 22% from 2008 to 2018.
  • In 2018, the portion of adults on community supervision was at its lowest level since 1990.
  • An estimated 1 in 58 adults in the U.S. were under community supervision at the end of 2018, down from 1 in 45 in 2008.

Probation and Parole in the United States, 2020

An estimated 3,890,400 adults were under community supervision at yearend 2020, which was a 6.6% decline from the 4,167,100 who were supervised in the community on January 1, 2020. This decline was solely driven by a reduction in people on probation, who made up the majority (79%) of the community supervision population. During 2020, the number of people on probation decreased from 3,330,200 to 3,053,700 (down 8.3%), the largest annual decline since the Bureau of Justice Statistics (BJS) began the probation collection in 1980. The number of adults on parole increased 1.3% during 2020, from 851,000 on January 1, 2020 to 862,100 at yearend. Among all adult U.S. residents, 1 in 66 were supervised in the community at yearend 2020.

Provisional Mortality Data — United States, 2020

What is already known about this topic?

The COVID-19 pandemic caused approximately 375,000 deaths in the United States during 2020.

What is added by this report?

The age-adjusted death rate increased by 15.9% in 2020. Overall death rates were highest among non-Hispanic Black persons and non-Hispanic American Indian or Alaska Native persons. COVID-19 was the third leading cause of death, and the COVID-19 death rate was highest among start highlightnon-Hispanic American Indian or Alaska Native personsend highlight.

What are the implications for public health practice?

Provisional death estimates provide an early indication of shifts in mortality trends. Timely and actionable data can guide public health policies and interventions for populations experiencing higher numbers of deaths that are directly or indirectly associated with the COVID-19 pandemic.

Provisional Mortality Data — United States, 2020

CDC’s National Vital Statistics System (NVSS) collects and reports annual mortality statistics using data from U.S. death certificates. This report presents an overview of provisional U.S. mortality data for 2020, including the first ranking of leading causes of death. In 2020, approximately 3,358,814 deaths occurred in the United States. From 2019 to 2020, the estimated age-adjusted death rate increased by 15.9%, from 715.2 to 828.7 deaths per 100,000 population. COVID-19 was reported as the underlying cause of death or a contributing cause of death for an estimated 377,883 (11.3%) of those deaths (91.5 deaths per 100,000).

Public Sector Employee Views on Finances and Employment Outlook Due to COVID-19

On March 11, 2020, the World Health Organization declared the coronavirus (COVID-19) outbreak a pandemic. Since then, the United States and countries throughout the world have seen cases of COVID-19 soar. As of June 15, 2020, nearly 8 million cases and 435,000 deaths have been recorded around the world, with the United States accounting for more than 2 million cases and 115,000 deaths. During this time, the crucial role that state and local government workers play in everyday activities has been more visible than usual. From emergency medical technicians and nurses to teachers, public safety personnel, and public health professionals, the more than 19 million state and local government workers have been integral to keeping the country running.

This report assesses state and local government employees’ views on the COVID-19 pandemic’s impacts on their finances, job, debt profile, and related issues. It presents the results of an online survey of 1,008 state and local government employees conducted by State and Local Government Excellence and Greenwald & Associates May 4-20, 2020.

Quick Facts on Native American Offenders

Native American offenders accounted for a small portion of federal offenders (1.9%) in fiscal year 2020. The number of Native American offenders decreased from 1,562 offenders in fiscal year 2019 to 1,248 offenders in fiscal year 2020. 

Rates for Interstate Inmate Calling Services

In this document, the Commission continues to comprehensively reform inmate calling services rates to ensure just and reasonable rates for interstate and international inmate calling services. Specifically, the Commission proposes to lower the current interstate rate caps to $0.14 per minute for debit, prepaid, and collect calls from prisons and $0.16 per minute for debit, prepaid, and collect calls from jails. The Commission also proposes to cap rates for international inmate calling services, which remain uncapped today. The Commission proposes a waiver process that would allow providers to seek relief from its rules at the facility or contract level if they can demonstrate that they are unable to recover their legitimate inmate calling services-related costs at that facility or for that contract. Finally, the Commission invites comment on whether the Commission should require the providers to submit additional data, and if so, how; on how the Commission's regulation of interstate and international inmate calling services should evolve in light of marketplace developments and innovations, including alternative rate structures; and on the needs of incarcerated people with hearing or speech disabilities.

Reducing Jail and Prison Populations During the Covid-19 Pandemic

Prisons and jails frequently suffer from overcrowding. Even in the best of times they are, by definition, facilities where people are placed in close contact with each other on a near-constant basis. This article examines ways correctional administrators can improve outcomes for those held in facilities during the COVID-19 pandemic.

Should the Federal Workforce Stay Remote? Planning for After the Crisis

There is no telling yet if this surge of new telecommuting will break after the COVID-19 crisis subsides, or if it will build into a permanent new wave of remote government workers. What is likely though is that it will be difficult for some managers to quickly stuff the genie back in the bottle. They, as well as their workforces, will have experienced work-ready mornings sans commute along with other benefits that remote working offers. They will have overcome many of the difficulties and anxieties associated with telework and may have disproven any theories that work roles in their organization cannot be conducted outside the office. Necessity is the mother of invention as they say, and success is the best measure available.

But should federal agencies maintain their remote operations for the long haul?

Since You Asked: Can Correctional Facilities Negotiate Phone Contracts That Prohibit Deposit Fees? (Yes! Many do.)

The high cost of calling home from prisons and jails gets a lot of attention in the press, but the industry’s practice of tacking on hidden fees is getting an increasing amount of attention from regulators and the savviest correctional facilities. These fees can be called by a variety of different names and can add up to significant costs to the families of people in prison. The problem got so bad that the companies were potentially making more from fees than from selling their product — phone calls.

State and Local Government Workforce: 2020 Survey

The Center for State and Local Government Excellence (SLGE), in partnership with the International Public Management Association for Human Resources (IPMA-HR) and the National Association of State Personnel Executives (NASPE), has been surveying human resources directors in state and local governments since 2009. This year’s survey continues many of the questions from that original survey, with additional detail around emerging issues such as flexible workplace policies, positions that are difficult to fill, and the reasons for separation as discussed in exit interviews. This year’s survey was conducted from February 27 to April 7, 2020, with a total of 222 respondents. The growing scale of the COVID-19 pandemic during this time meant that a number of jurisdictions were dealing with changed working conditions, from office closures to additional time spent on continuity of operations decisions around essential services.

States Can Shorten Probation and Protect Public Safety

More than 3.5 million, or 1 in 72, adults were on probation in the United States at the end of 2018—the most recent year for which U.S. Bureau of Justice Statistics (BJS) data is available—more than triple the number in 1980. Nationwide, on any given day, more people are on probation than in prisons and jails and on parole combined.

At its best, probation—court-ordered correctional supervision in the community—gives people the opportunity to remain with their families, maintain employment, and access services that can reduce their likelihood of reoffending while serving their sentences. But, as previous research by The Pew Charitable Trusts has shown, the growth and size of this population have overloaded local and state agencies and stretched their resources thin, weakening their ability to provide the best return on taxpayers’ public safety investments, support rehabilitation, and ensure a measure of accountability. One key factor driving the size of the probation population is how long individuals remain on supervision.

A growing list of high-quality studies have shown that long probation sentences are not associated with lower rates of recidivism and are more likely than shorter ones to lead to technical violations—noncompliance with one or more supervision rules, such as missing appointments or testing positive for drug use. Recent research from the Council of State Governments has found that such violations contribute significantly to state incarceration rates and correctional costs: More than 1 in 10 state prison admissions are the result of technical violations of probation rather than convictions for a new crime.

To date, the average length of probation has not been well documented, because data on individual terms has been lacking. To begin addressing this gap and help criminal justice stakeholders better understand how long people spend on probation—as well as the effects of term length on individual recidivism outcomes— The Pew Charitable Trusts conducted an in-depth analysis of BJS data from 2000 through 2018. Additionally, Maxarth LLC examined Oregon and South Carolina data to quantify the potential to reduce probation lengths without increasing re-offending in those states, and the National Conference of State Legislatures (NCSL) reviewed probation sentencing statutes in all 50 states. This report provides a first-of-its-kind national and state-level portrait of the average length of probation and explores whether term lengths can be safely reduced and what options are available for state policymakers looking to improve their system’s outcomes.

States’ 2020 Personal Income Growth Was Highest in 20 Years

Every state experienced an uptick in total personal income last year as historic gains in unemployment benefits, federal aid, and other public assistance drove the sharpest annual growth in two decades. Without government support, most states would have sustained declines in personal income—a key economic indicator—as the COVID-19 pandemic took a toll on business activity.

Government assistance swelled in 2020 compared with a year earlier as policymakers pumped money into the economy to help Americans weather the pandemic, which upended normal economic patterns and left millions unemployed for much of the year. The sharp increase in government transfer payments more than offset a slight decline in inflation-adjusted earnings, which include wages from work plus extra compensation such as employer-sponsored health benefits, as well as business profits. Nationally, the sum of residents’ personal income from all sources rose 4.9% in 2020, the largest annual increase since 2000, after adjusting for inflation.

The 2020 Census: Our Growing Nation

Today the U.S. Census Bureau is releasing results from the 2020 Census, marking the 24th time the nation’s population has been counted since the first census in 1790, when there were just 3.9 million people living in the United States.

The first census helped build the foundation of our democracy, and the census continues to be a cornerstone for our growing nation.

According to the 2020 Census, there were 331,449,281 people living in the United States as of April 1, 2020, which represents a growth of 7.4% since 2010. In the last 100 years, our nation has tripled in size.

The COVID Prison Project Tracks Data and Policy Across the Country to Monitor COVID-19 in Prisons

The site offers analysis and resources to better understand how coronavirus is impacting people who are incarcerated. The COVID Prison Project tracks data from all 50 US states, Puerto Rico, the Federal Bureau of Prisons, and Immigration and Customs Enforcement (ICE).

The Employment Situation - April 2020

The Bureau of Labor and Statistics provides information on the employment situation. Total nonfarm payroll employment fell by 20.5 million in April, and the unemployment rate rose to 14.7 percent, the U.S. Bureau of Labor Statistics reported. The changes in these measures reflect the effects of the coronavirus (COVID-19) pandemic and efforts to contain it. Employment fell sharply in all major industry sectors, with particularly heavy job losses in leisure and hospitality. This news release presents statistics from two monthly surveys. The household survey measures labor force status, including unemployment, by demographic characteristics. The establishment survey measures nonfarm employment, hours, and earnings by industry. 

The Future of Jobs Report 2020

The COVID-19 pandemic-induced lockdowns and related global recession of 2020 have created a highly uncertain outlook for the labour market and accelerated the arrival of the future of work. The Future of Jobs Report 2020 aims to shed light on: 1) the pandemic-related disruptions thus far in 2020, contextualized within a longer history of economic cycles, and 2) the expected outlook for technology adoption jobs and skills in the next five years. Despite the currently high degree of uncertainty, the report uses a unique combination of qualitative and quantitative intelligence to expand the knowledge base about the future of jobs and skills. It aggregates the views of business leaders—chief executives, chief strategy officers and chief human resources officers–on the frontlines of decision-making regarding human capital with the latest data from public and private sources to create a clearer picture of both the current situation and the future outlook for jobs and skills. The report also provides in-depth information for 15 industry sectors and 26 advanced and emerging countries.

The Global Economic Cost of COVID-19 Vaccine Nationalism

Millions of people worldwide have been infected with COVID-19 and so far, more than a million have lost their lives because of the pandemic. A huge global research effort is taking place to bring a fast-tracked vaccine to the market. Currently there are more than 165 vaccines being developed, with some already in human trials.

Even when a safe and effective COVID-19 vaccine or treatment is eventually developed, further challenges will emerge with regard to the manufacturing and distribution process. There is a threat that 'vaccine nationalism' could have negative consequences on how well the global pandemic is managed and contained.

In light of this, RAND Europe sought to understand how vaccine nationalism would affect the global crisis once a COVID-19 vaccine is developed and examined the economic effects that could arise as a result of unequal access to the vaccine.

The Pace of Boomer Retirements Has Accelerated in the Past Year

More than 70 million Baby Boomers reside in the U.S. Since the time that the oldest Boomers reached age 65, there has been public interest in their impact on the nation’s labor force, public social insurance programs and asset values. The COVID-19 recession resulted in a large and sharp employment contraction across generations. This analysis looked at whether retirements had accelerated among Boomers during the pandemic.

The COVID-19 outbreak has affected data collection efforts by the U.S. government in its surveys, especially limiting in-person data collection. This resulted in about a 4 percentage point decrease in the response rate for the CPS in September 2020. It is possible that some measures of retirement and labor market activity and its demographic composition are affected by these changes in data collection.

The Top 50 Most Valuable Global Brands

Visualizing the Top 50 Most Valuable Global Brands

For many brands, it has been a devastating year to say the least.

Over half of the most valuable global brands have experienced a decline in brand value, a measure that takes financial projections, brand roles in purchase decisions, and strengths against competitors into consideration. But where some have faltered, others have asserted their dominance and stepped up for their customers like never before.


The World Factbook

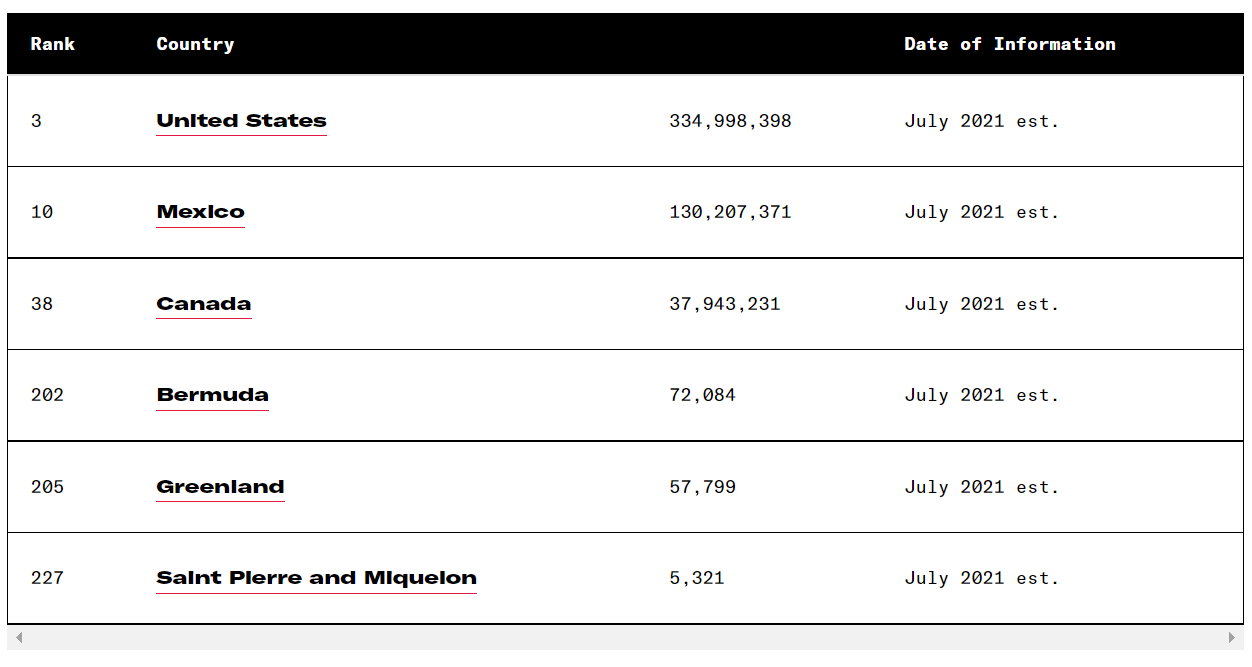
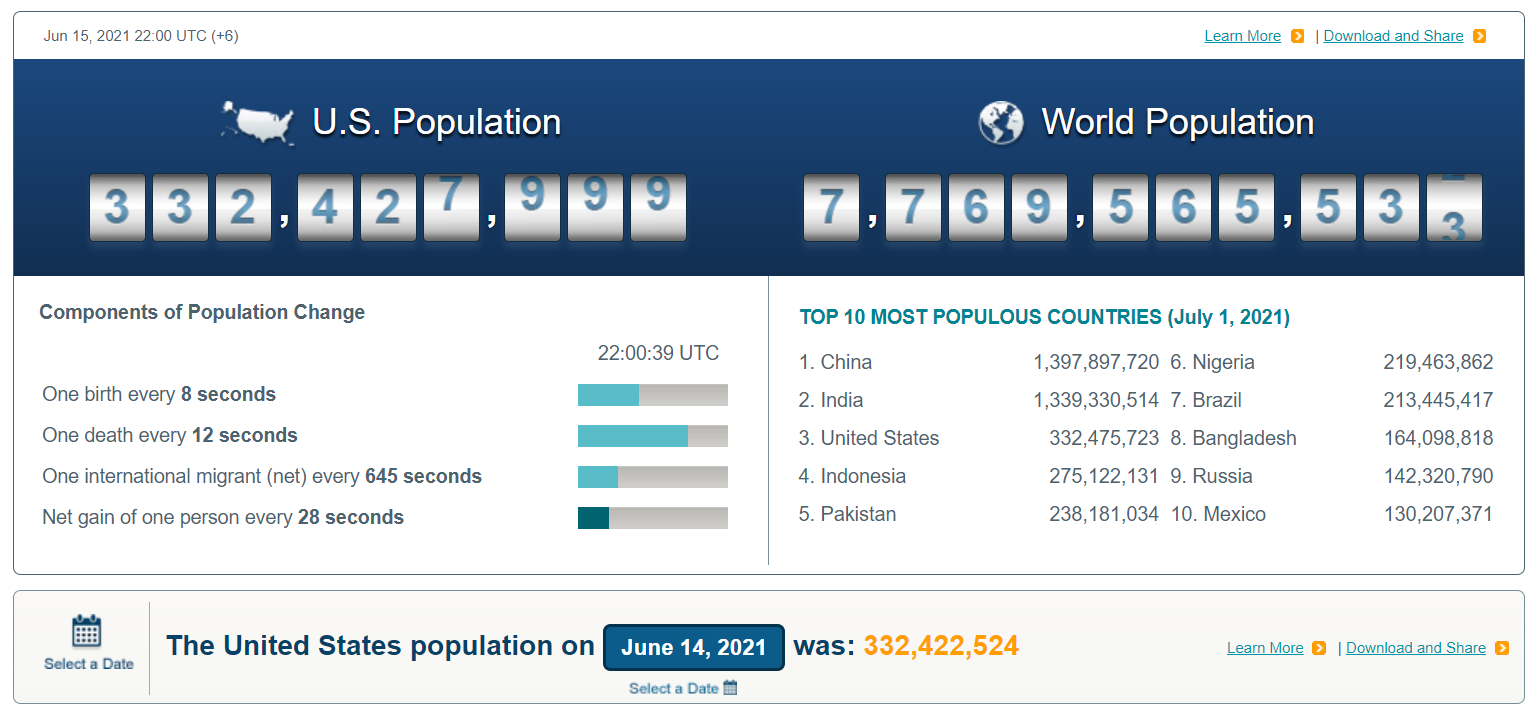
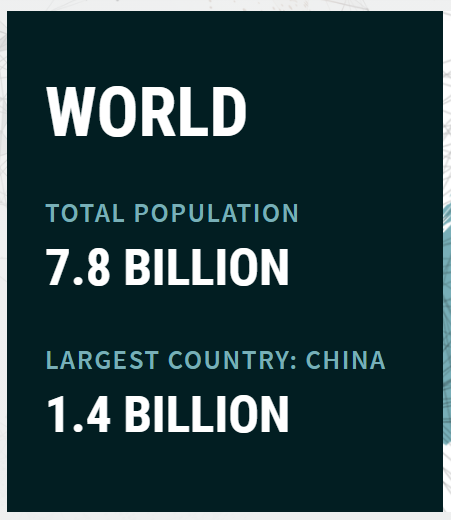
This entry gives an estimate from the US Bureau of the Census based on statistics from population censuses, vital statistics registration systems, or sample surveys pertaining to the recent past and on assumptions about future trends. The total population presents one overall measure of the potential impact of the country on the world and within its region. Note: Starting with the 1993 Factbook, demographic estimates for some countries (mostly African) have explicitly taken into account the effects of the growing impact of the HIV/AIDS epidemic. These countries are currently: The Bahamas, Benin, Botswana, Brazil, Burkina Faso, Burma, Burundi, Cambodia, Cameroon, Central African Republic, Democratic Republic of the Congo, Republic of the Congo, Cote d'Ivoire, Ethiopia, Gabon, Ghana, Guyana, Haiti, Honduras, Kenya, Lesotho, Malawi, Mozambique, Namibia, Nigeria, Rwanda, South Africa, Swaziland, Tanzania, Thailand, Togo, Uganda, Zambia, and Zimbabwe.

Top 10 Emerging Technologies 2020

Experts highlight advances with the potential to revolutionize industry, healthcare and society if some of the many thousands of human volunteers needed to test coronavirus vaccines could have been replaced by digital replicas – one of this year’s Top 10 Emerging Technologies – COVID-19 vaccines might have been developed even faster, saving untold lives. Soon virtual clinical trials could be a reality for testing new vaccines and therapies. Other technologies on the list could reduce greenhouse gas (GHG) emissions by electrifying air travel and enabling sunlight to directly power the production of industrial chemicals. With “spatial” computing, the digital and physical worlds will be integrated in ways that go beyond the feats of virtual reality. And ultrasensitive sensors that exploit quantum processes will set the stage for such applications as wearable brain scanners and vehicles that can see around corners. These and the other emerging technologies have been singled out by an international steering group of experts. The group, convened by Scientific American and the World Economic Forum, sifted through more than 75 nominations. To win the nod, the technologies must have the potential to spur progress in societies and economies by outperforming established ways of doing things. They also need to be novel (that is, not currently in wide use) yet likely to have a major impact within the next three to five years. The steering group met (virtually) to whittle down the candidates and then closely evaluate the front-runners before making the final decisions.

U.S. and World Population Clock

The U.S. population total and population change have been adjusted to be consistent with the results of the 2020 Census. The components of population change have not been adjusted and so inconsistencies will exist between population values derived directly from the components and the population displayed in the odometer and the Select a Date tool.

The U.S. population clock is based on a series of short-term projections for the resident population of the United States. This includes people whose usual residence is in the 50 states and the District of Columbia. These projections do not include members of the Armed Forces overseas, their dependents, or other U.S. citizens residing outside the United States.

The projections are based on a monthly series of population estimates starting with the April 1, 2010 resident population from the 2010 Census.

At the end of each year, a new series of population estimates, from the census date forward, is used to revise the postcensal estimates, including the population clock projections series. Once a series of monthly projections is completed, the daily population clock numbers are derived by interpolation. Within each calendar month, the daily numerical population change is assumed to be constant, subject to negligible differences caused by rounding.

Under Trump, The Federal Prison Population Continued Its Recent Decline

The federal prison population, which declined for the first time in decades under President Barack Obama, fell further during the administration of President Donald Trump.

The number of federal prisoners sentenced to more than a year behind bars decreased by 5% (or 7,607 inmates) between 2017, Trump’s first year in office, and the end of 2019, the most recent year for which final data is available from the Bureau of Justice Statistics. Preliminary figures for 2020 show that the decline continued – and even accelerated – during Trump’s last full year in office, meaning that the overall reduction in inmates during his tenure will likely exceed 5% once final data is available. Part of the decrease in prisoners in 2020 may have been attributable to policy changes in response to the coronavirus pandemic.

Unlocking Technology for the Global Goals

The potential of Fourth Industrial Revolution technologies to tackle major global challenges – such as poverty, climate change, nature loss and inequality – is immense, yet this potential is far from being reached. To this end, the Forum’s Centre for Global Public Goods is scaling up efforts to proactively engage stakeholders to channel Fourth Industrial Revolution innovations towards positive social, economic and environmental outcomes through a series of initiatives. Frontier 2030 – a new Fourth Industrial Revolution for Global Goals Platform, which this report supports, aims at facilitating the application of advanced technologies to help achieve the Sustainable Development Goals (herein referred to as the Global Goals). It builds on calls from the United Nations (UN) High-Level Panel on Digital Cooperation for a multistakeholder approach that brings together technology companies, government, civil society and international organization leaders to collaborate and unlock broader barriers to responsible deployment of new technologies to deliver positive societal impact. 

Use of Structured Sanctions and Incentives in Probation and Parole Supervision

Key points of this brief:
• The use of sanction grids or matrices to respond to client behavior has not been shown to have a
significant impact on recidivism outcomes. There are no evaluations of grids/matrices that include
both sanctions and incentives.
• The use of sanction grids/matrices are associated with better uses of agency resources and reduced
use of jail or prison sanctions.
• There is strong evidence that the use of incentives by supervising officers produces improved
supervision outcomes for individuals convicted of more serious offenses and people classified as
higher risk to reoffend.
• Implementation challenges can interfere with the effectiveness of structured sanction and incentive
policies.

Wearable Sensor Technology and Potential Uses Within Law Enforcement

Many wearable sensor technology (WST) devices on the market enable individuals and organizations to track and monitor personal health metrics in real time. These devices are worn by the user and contain sensors to capture various biomarkers. Although these technologies are not yet sufficiently developed for law enforcement purposes overall, WSTs continue to advance rapidly and offer the potential to equip law enforcement officers and agencies with data to improve officer safety, health, and wellness.

The RAND Corporation and the Police Executive Research Forum, on behalf of the National Institute of Justice, organized a workshop of practitioners, researchers, and developers to discuss the current state of WST and how it might be applied by law enforcement organizations. Workshop participants discussed possible issues with acceptance of WST among members of law enforcement; new policies that will be necessary if and when WST is introduced in a law enforcement setting; and what data are gathered, how these data are collected, and how they are interpreted and used.

Which Countries Have Mandatory Childhood Vaccination Policies?

With the widespread rollout of COVID-19 vaccines globally, some countries have started to consider mandatory vaccination, although no country has yet to make vaccines mandatory for its population. While COVID-19 has resurfaced the debate on vaccination policies, it has been an important topic for many other diseases. The World Health Organization (WHO) estimates that vaccines save two to three million lives each year (excluding COVID). The development of vaccines against vaccine-preventable childhood diseases has been a key driver in the decline of child mortality.

Despite it being such an important topic, it is surprising that information about which countries have mandatory vaccine policy is lacking, and it is childhood vaccines under a country’s national immunization schedules that are most commonly made mandatory.

Will This School Year Be Another Casualty of the Pandemic? Key Findings from the American Educator Panels Fall 2020 COVID-19 Surveys

School districts across the United States have had to make many difficult decisions to prepare for the 2020–2021 school year amid the ongoing coronavirus disease 2019 (COVID-19) pandemic. However, until now, little information has been gathered directly from teachers and principals about what is happening on the ground, their perceptions of how students are faring, and which students they feel are most at risk of falling behind.

In this Data Note, researchers summarize selected findings on teaching and learning in the face of a pandemic by drawing on surveys administered via the RAND American Educator Panels (AEP) to nationally representative samples of teachers and principals in early October 2020. The findings paint an alarming picture of how the 2020–2021 school year is unfolding. Even though teachers are working more hours than they were before the pandemic, students are likely not getting all the curriculum content and instruction that they would have received during a normal school year. Students from vulnerable populations might be particularly likely to slip through the cracks. High proportions of teachers report that they are not receiving adequate guidance to serve many of these populations — especially if they are teaching them remotely — and low percentages of principals indicate that their schools are offering the tutoring needed to help students catch up. There are no signs that the pandemic is slowing, and policymakers must act fast to ensure that the entire school year is not another one of its casualties.

Women Are Leaving the Labor Force in Record Numbers

Claudia Goldin, former head of the American Economic Association, called the period beginning in the mid-1970s the quiet revolution in women's labor. The ranks of female workers had grown steadily after World War II, but what changed drastically starting in the '70s, according to Goldin, wasn't the raw numbers, but mindset. Women made employment decisions for themselves, they pursued careers, and their work became part of their identity. The COVID-19 pandemic, by any measure, has been a blow to that identity. Piled atop challenges such as pay disparities and expensive childcare is an economic downturn that hit women workers measurably harder than men—the so-called “she-cession.” One particularly sobering number: According to the U.S. Bureau of Labor Statistics, there were 2.2 million fewer women in the labor force in October 2020 than there were in October 2019.

Women Make Gains in the Workplace Amid a Rising Demand for Skilled Workers

Employers in the United States are increasingly in pursuit of workers who are adept in social skills, like negotiation and persuasion, and have a strong grounding in fundamental skills, such as critical thinking and writing. In the past nearly four decades, employment in the U.S. has expanded most rapidly in jobs in which these skill sets are most valued. Jobs attaching greater importance to analytical skills, such as science, mathematics and programming, are also hiring workers at a brisk pace. 

World Economic Outlook: A Long and Difficult Ascent

The months after the release of the June 2020 World Economic Outlook (WEO) Update have offered a glimpse of how difficult rekindling economic activity will be while the pandemic surges. During May and June, as many economies tentatively reopened from the Great Lockdown, the global economy started to climb from the depths to which it had plunged in April. But with the pandemic spreading and accelerating in places, many countries slowed reopening, and some are reinstating partial lockdowns. While the swift recovery in China has surprised on the upside, the global economy’s long ascent back to pre-pandemic levels of activity remains prone to setbacks.

World Economic Outlook: The Great Lockdown

The COVID-19 pandemic is inflicting high and rising human costs worldwide, and the necessary protection measures are severely impacting economic activity. As a result of the pandemic, the global economy is projected to contract sharply by –3 percent in 2020, much worse than during the 2008–09 financial crisis. In a baseline scenario--which assumes that the pandemic fades in the second half of 2020 and containment efforts can be gradually unwound—the global economy is projected to grow by 5.8 percent in 2021 as economic activity normalizes, helped by policy support. The risks for even more severe outcomes, however, are substantial. Effective policies are essential to forestall the possibility of worse outcomes, and the necessary measures to reduce contagion and protect lives are an important investment in long-term human and economic health. Because the economic fallout is acute in specific sectors, policymakers will need to implement substantial targeted fiscal, monetary, and financial market measures to support affected households and businesses domestically. And internationally, strong multilateral cooperation is essential to overcome the effects of the pandemic, including to help financially constrained countries facing twin health and funding shocks, and for channeling aid to countries with weak health care systems.

World Economic Situation and Prospects 2020

Energy transition and the global economy

The global economy has suffered a significant slowdown amid prolonged trade disputes and wide-ranging policy uncertainties. While a slight uptick in economic activity is forecast for 2020, the World Economic Situation and Prospects 2020 warns that economic risks remain strongly tilted to the downside, aggravated by deepening political polarization and increasing scepticism over the benefits of multilateralism. These risks could inflict severe and long-lasting damage on development prospects. They also threaten to encourage a further rise in inward-looking policies, at a point when global cooperation is paramount.

Compounding the economic slowdown, rising global temperatures and the increasing frequency and intensity of weather-related shocks press home the urgent need for a dramatic shift in the global energy mix. The World Economic Situation and Prospects 2020 explores the global economic implications of this energy transition. The transition to a cleaner energy mix will bring not only environmental and health benefits, but economic opportunities for many. However, without appropriate policy strategies, the costs and benefits will be unevenly distributed within and between countries.

World Employment and Social Outlook: Trends 2020

This report provides an overview of global and regional trends in employment, unemployment, labour force participation and productivity. Key findings are that unemployment is projected to rise after a long period of stability, and that many people are working fewer paid hours than they would like or lack adequate access to paid work. The report also takes a close look at decent work deficits and persistent labour market inequalities, noting that income inequality is higher than previously thought.

World Population Ageing 2020 Highlights: Living arrangements of older persons

The world continues to experience an unprecedented and sustained change in the age structure of the global population, driven by increasing levels of life expectancy and decreasing levels of fertility. People are living longer lives, and both the share and the number of older persons in the total population are growing rapidly. Globally, there were 727 million persons aged 65 years or over in 2020. Since women live longer than men, on average, they comprise the majority of older persons, especially at advanced ages. Over the next three decades, the number of older persons worldwide is projected to more than double, reaching over 1.5 billion in 2050. All regions will see an increase in the size of the older population between 2020 and 2050. Globally, the share of the population aged 65 years or over is expected to increase from 9.3 per cent in 2020 to around 16.0 per cent in 2050.

World Population Data Sheet 2020

Published since 1962, PRB’s annual World Population Data Sheet tracks global population data. This year’s edition provides 24 population indicators for more than 200 countries and territories. Users can also explore key trends through an interactive map.

“As the experience with the COVID-19 pandemic has shown us, population changes such as aging and rapid urbanization are important factors for countries to consider as they plan for future disease outbreaks, long-term health care needs and other developments,” said Jeff Jordan, PRB president and CEO. “PRB’s World Population Data Sheet provides objective data and analysis policymakers need to make these decisions.”

Among the key findings for 2020:

  • The world population is projected to reach 9.9 billion by 2050, an increase of more than 25% from 2020.
  • The global total fertility rate is 2.3 births per woman, while the replacement level is 2.1 births per woman.
  • Western Europe and Southern Europe have the largest shares of people ages 65 years and older (21%), while sub-Saharan Africa has the smallest share (3%).

Worldometers - World Population Clock

Population in the world is currently (2020) growing at a rate of around 1.05% per year (down from 1.08% in 2019, 1.10% in 2018, and 1.12% in 2017). The current average population increase is estimated at 81 million people per year.

Annual growth rate reached its peak in the late 1960s, when it was at around 2%. The rate of increase has nearly halved since then, and will continue to decline in the coming years.

World population will therefore continue to grow in the 21st century, but at a much slower rate compared to the recent past. World population has doubled (100% increase) in 40 years from 1959 (3 billion) to 1999 (6 billion). It is now estimated that it will take another nearly 40 years to increase by another 50% to become 9 billion by 2037.

The latest world population projections indicate that world population will reach 10 billion persons in the year 2057.