Population Demographics

Today the U.S. Census Bureau is releasing results from the 2020 Census, marking the 24th time the nation’s population has been counted since the first census in 1790, when there were just 3.9 million people living in the United States.

The first census helped build the foundation of our democracy, and the census continues to be a cornerstone for our growing nation.

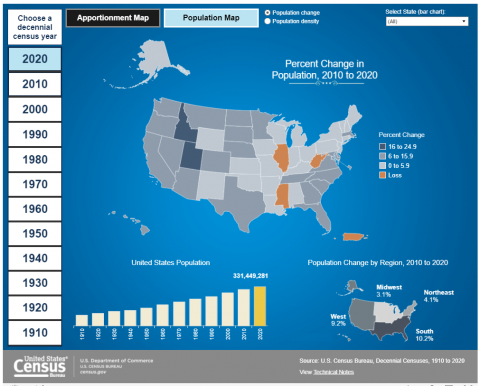
According to the 2020 Census, there were 331,449,281 people living in the United States as of April 1, 2020, which represents a growth of 7.4% since 2010. In the last 100 years, our nation has tripled in size.

Apportionment is the process of dividing the 435 memberships, or seats, in the U.S. House of Representatives among the 50 states. At the conclusion of each decennial census, the results are used to calculate the number of seats to which each state is entitled. Each of the 50 states is entitled to a minimum of one seat in the U.S. House of Representatives.

The 2020 Census apportionment population includes the resident population of the 50 states, plus a count of the U.S. military personnel and federal civilian employees living outside the United States (and their dependents living with them) who can be allocated to a home state. The population of the District of Columbia is not included in the apportionment population.

The U.S. population total and population change have been adjusted to be consistent with the results of the 2020 Census. The components of population change have not been adjusted and so inconsistencies will exist between population values derived directly from the components and the population displayed in the odometer and the Select a Date tool.

The U.S. population clock is based on a series of short-term projections for the resident population of the United States. This includes people whose usual residence is in the 50 states and the District of Columbia. These projections do not include members of the Armed Forces overseas, their dependents, or other U.S. citizens residing outside the United States.

Vera Institute of Justice researchers collected data on the number of people in local jails and state and federal prisons at both midyear and fall 2020 to provide timely information on how incarceration is changing in the United States during the COVID-19 pandemic. Researchers estimated the national jail population using a sample of 1,558 jail jurisdictions and the national prison population based on a sample of 49 states and the Federal Bureau of Prisons. Vera also collected data on people incarcerated and detained by the U.S. Marshals Service (USMS) and Immigration and Customs Enforcement (ICE).

 In fiscal year 2020, there were 19,654 offenders convicted of illegal reentry, accounting for 82.7% of all immigration offenders sentenced under the guidelines. Illegal reentry convictions have increased by 24.3% since fiscal year 2016.

Native American offenders accounted for a small portion of federal offenders (1.9%) in fiscal year 2020. The number of Native American offenders decreased from 1,562 offenders in fiscal year 2019 to 1,248 offenders in fiscal year 2020. 

This report is the 27th in a series that began in 1980. It provides national data on the adult population on probation or parole in 2017 and 2018. It describes trends in the overall community-supervision population and annual changes in probation and parole populations.

This report is the 23rd in a series that began in 1985. It provides statistics on populations supervised by adult correctional systems in the United States, including persons held in prisons or jails and those supervised in the community on probation or parole. It provides statistics on the size of the correctional populations at year-end 2017 and year-end 2018, and changes in populations over time.

This report is the 32nd in a series that began in 1982. It provides statistics based on BJS's Annual Survey of Jails and Census of Jail Inmates. It describes the number of inmates held in local jails, jail incarceration rates, demographic characteristics of jail inmates, number of admissions to jail, jail capacity, inmate turnover rates, and staff employed in local jails.

This report is the 94th in a series that began in 1926. It provides counts of prisoners under the jurisdiction of state and federal correctional authorities in 2019 and includes findings on admissions, releases, and imprisonment rates. It describes demographic and offense characteristics of state and federal prisoners.