Total Environmental Scan

Page Description Here

2018 and newer

There has been growing acknowledgment among scholars, prison staff, and policy-makers that gender-informed thinking should feed into penal policy but must be implemented holistically if gains are to be made in reducing trauma, saving lives, ensuring emotional wellbeing, and promoting desistance from crime. This means that not only healthcare services and psychology programs must be sensitive to individuals’ trauma histories but that the architecture and design of prisons should also be sympathetic, facilitating, and encouraging trauma-informed and trauma-sensitive practices within.

The WRNA was originally created through a cooperative agreement between the National Institute of Corrections and the University of Cincinnati through research conducted by Patricia Van Voorhis, Emily Salisbury, Emily Wright, and Ashley Bauman. The instrument is now managed by Dr. Emily Salisbury at Utah Criminal Justice Center (UCJC), College of Social Work University of Utah.
The WRNA is a public-domain instrument. However, there are conditions of use, a license agreement, and training costs associated with its implemenation.
This webpage from Utah Criminal Justice Center (UCJC), College of Social Work University of Utah has links to research articles written about the WRNA over the last 13 years.

Washington had the fastest growth in the fourth quarter

Real gross domestic product (GDP) increased in 48 states and the District of Columbia in the fourth quarter of 2019, according to statistics released today by the U.S. Bureau of Economic Analysis. The percent change in real GDP in the fourth quarter ranged from 3.4 percent in Washington and Utah to -0.1 percent in West Virginia (table 1).

The U.S. economy has been on a long, slow upward trend for eight years, but a Cornell economist predicts that – like all good things – the steady growth will soon come to an end, likely by the end of the year.

It won’t be a disastrous scenario like the 2009 recession, but rather a garden-variety reaction to the Federal Reserve raising interest rates and, in turn, interest-sensitive sectors cooling off, he said.

Are you looking for a fresh start in 2019? Maybe you’d like to get fit? Learn a new skill? Or change career?

According to analysis from networking site LinkedIn, 2019’s employers are looking for a combination of both hard and soft skills, with creativity topping the list of desired attributes. The findings chime with the World Economic Forum’s Future of Jobs report, which concluded that “human” skills like originality, initiative and critical thinking are likely to increase in value as technology and automation advances.

The U.S. leads the global landscape in technology innovation. The country’s competitive edge, according to the World Economic Forum’s 2018 Global Competitive Index, is due to its business dynamism, strong institutional pillars, financing mechanisms, and vibrant innovation ecosystem.[1] Innovation is a trademark feature of American competitiveness and has powered its global dominance since the post-World-War industrial revolution. Countries that lead the world in generating advanced technologies and leveraging the full productive capacity of their digital economies can gain a strategic competitive advantage.

An estimated 6,613,500 persons were under the supervision of U.S. adult correctional systems on December 31, 2016 (figure 1). The adult correctional population consists of persons held in prisons and jails and persons on probation and parole. The correctional population decreased 0.9% from January 1, 2016, to December 31, 2016. From 2007 to 2016, the correctional population declined by an average of 1.2% annually, ranging from a decrease of 0.4% in 2008 to 2.1% in 2010. At year-end 2016, about 1 in 38 persons in the United States were under correctional supervision. This report summarizes data from several Bureau of Justice Statistics (BJS) collections on populations supervised by adult correctional systems in the United States. (See Methodology.) 

Statistics on revenue, expenditure, debt, and assets (cash and security holdings) for US governments. There are statistics for the 50 state areas and the District of Columbia, as well as a national summary.

Please read the accompanying documentation for the individual unit file before using these data. It can be found in the .zip file below.          

This report examines the civil rights of women in United States prisons. The population of women in prison has increased dramatically since the 1980s, and this growth has outpaced that of men in prison, yet there have been few national-level studies of the civil rights issues incarcerated women experience.The Commission studied a range of issues that impact incarcerated women, includingdeprivations of women’s medical needs that may violate the constitutional requirement to provide adequate medical care for all prisoners; implementation of the Prison Rape Elimination Act(PREA); and the sufficiency of programs to meet women’s needs afterrelease.

The federal deficit in 2019 was $984 billion, equal to 4.6 percent of gross domestic product. Learn more about the deficit with a new interactive version of the infographic.

This site shows the monthly and quarterly US employment data from the U.S. Bureau of Labor Statistics (BLS) for 2019.

The next two decades promise a full-scale revolution in our working lives. Before we look into the next 20 years, let’s take a quick look at the present – and something once considered paradoxical.

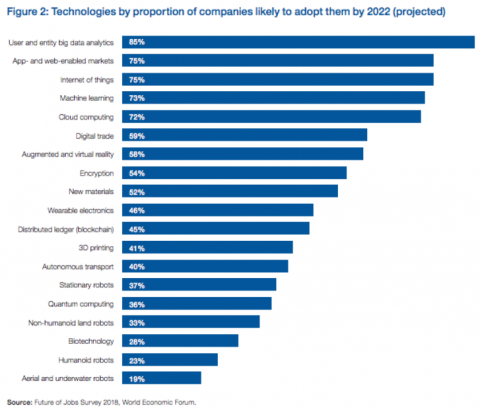
We’re already living in an age of a lot of robots – and a lot of jobs.

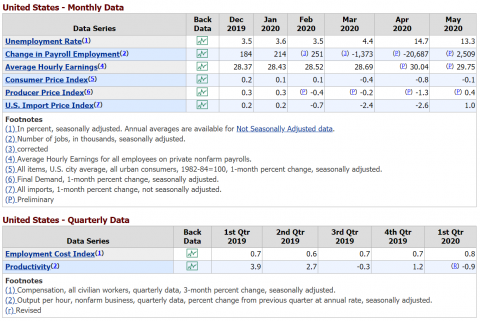
As the number of robots at work has reached record levels, it’s worth noting that in 2018 the global unemployment level fell to 5.2%, according to a report last month – the lowest level in 38 years.

In other words, high tech and high employment don’t have to be mutually exclusive. We’re living the proof of that today.

On December 21, 2018, President Trump signed into law the First Step Act of 2018 (P.L. 115- 391). The act was the culmination of several years of congressional debate about what Congress might do to reduce the size of the federal prison population while also creating mechanisms to maintain public safety. 

About the Population Clock and Population Estimates

U.S. Population

The U.S. population clock is based on a series of short-term projections for the resident population of the United States. This includes people whose usual residence is in the 50 states and the District of Columbia. These projections do not include members of the Armed Forces overseas, their dependents, or other U.S. citizens residing outside the United States.

The projections are based on a monthly series of population estimates starting with the April 1, 2010 resident population from the 2010 Census.

Doubts about the current system of mass incarceration emerge in a nationally representative survey, even in more politically conservative, rural parts of the country. Indeed, in an era of broad speculation about a growing urban-rural divide, there is general consensus between rural America, small cities and major metropolitan areas that the criminal justice system is not working and communities should focus on priorities other than spending millions on prisons and jails.

QuickFacts provides statistics for all states and counties, and for cities and towns with a population of 5,000 or more.

About datasets used in this table

Value Notes

Estimates are not comparable to other geographic levels due to methodology differences that may exist between different data sources.

Some estimates presented here come from sample data, and thus have sampling errors that may render some apparent differences between geographies statistically indistinguishable. Click the Quick Info icon to the left of each row in TABLE view to learn about sampling error.

This report from the Sentencing Project seeks to inform stakeholders in other states of the range of policy options available to them fo significantly reducing their prison population.  It will show how these states employed five key strategies to achieve these reductions and the report provides extensive reviews of the results.

Annual GDP by state in 2018

Real GDP increased in 49 states and the District of Columbia in 2018. The percent change in real GDP ranged from 5.7 percent in Washington to -0.3 percent in Alaska. Information services; professional, scientific, and technical services; and durable goods manufacturing were the leading contributors to national economic growth in 2018. Information services and retail trade were the leading contributors to the increase in real GDP in Washington, the fastest growing state.


Other highlights

Key Findings

  1. The criminal-justice arena faces an abundance of information technology opportunities. However, important barriers, including a lack of business cases; a lack of implementation plans and procedures; and a lack of security, privacy, and civil-rights protections, hinder its ability to take advantage of those opportunities.
  2. Agencies need to develop business cases and common processes for implementing new technologies.
  3. Research is needed to improve sharing of criminal-justice technology among practitioners and researchers.
    Read the report to learn more.

At a Glance

Each year, the Congressional Budget Office issues a set of long-term budget projections—that is, projections of what federal spending, revenues, deficits, and debt would be for the next 30 years if current laws generally did not change. This report is the latest in the series.

  • The population of 26 countries, nearly all in Africa, will at least double. Niger in West Africa will see its population nearly triple.
  • A total of 38 countries will have smaller populations in 2050 than in 2018. China will register the largest numerical population decrease―about 50 million―followed by Japan at 25 million and Russia at 9.4 million. Romania will see the largest percentage decline in population (23 percent).
  • The population of the United States will reach 390 million, up from 328 million in 2018.

This report examines the recidivism patterns of former prisoners during a 9-year follow-up period. The report provides data on the number and types of crimes prisoners commit after release, by offender characteristics, commitment offense, whether the arrest was within or outside the state of release, and whether released prisoners had no subsequent arrests during the follow-up period. It also shows how recidivism and desistance patterns change when using longer or shorter follow-up periods, including cumulative and annual arrest percentages, year of first arrest following release from prison, and the total number of arrests of released prisoners.

Insights From Fiscal 50’s Key Measures of State Fiscal Health

After years of slow progress, states benefited from a more promising economic and fiscal environment in 2018. Pressure on state finances eased somewhat as the second-longest economic recovery gained momentum and state tax revenue jumped, at least temporarily. Still, not all states have fully recovered from the shocks of the Great Recession more than a decade ago. Some are in a stronger position than others as they gauge how long the recovery will last.