Economy

Global

Economic trends that provide information and resources globally, domestically, and within the field of corrections.

2018 and newer

Fiscal 50: State Trends and Analysis, an interactive resource from The Pew Charitable Trusts, allows you to sort and analyze data on key fiscal, economic, and demographic trends in the 50 states and understand their impact on states’ fiscal health.

This year’s Global Competitiveness Report is the latest edition of the series launched in 1979 that provides an annual assessment of the drivers of productivity and long-term economic growth.

The global economy will continue to grow at a steady pace of around 3 percent in 2019 and 2020 amid signs that global growth has peaked. However, a worrisome combination of development challenges could further undermine growth, according to the United Nations World Economic Situation and Prospects (WESP) 2019, which was launched today.

UN Secretary-General António Guterres cautioned “While global economic indicators remain largely favourable, they do not tell the whole story.” He said the World Economic Situation and Prospects 2019 “raises concerns over the sustainability of global economic growth in the face of rising financial, social and environmental challenges.”

Global growth is forecast at 3.0 percent for 2019, its lowest level since 2008–09 and a 0.3 percentage point downgrade from the April 2019 World Economic Outlook. Growth is projected to pick up to 3.4 percent in 2020 (a 0.2 percentage point downward revision compared with April), reflecting primarily a projected improvement in economic performance in a number of emerging markets in Latin America, the Middle East, and emerging and developing Europe that are under macroeconomic strain.

From the early 1970s into the new millennium, the U.S. prison population experienced unprecedented growth, which had a direct influence on state budgets. In recent years, however, lawmakers in nearly every state and from across the political spectrum have enacted new laws to reduce prison populations and spending. This report, which builds upon the information found in Vera’s 2012 publication The Price of Prisons: What Incarceration Costs Taxpayers, found that 13 states were successful in reducing both population and spending. However, no single reason explains a rise or fall in spending; instead, a multitude of factors push and pull expenditures in different directions. Read the report and explore our interactive data visualization below to learn more.

Jails are far more expensive than previously understood, as significant jail expenditures—such as employee benefits, health care and education programs for incarcerated people, and general administration—are often not reflected in jail budgets, but rather in other county agencies. This report surveys 35 jail jurisdictions in 18 states to tally the actual price of their jails—and discovered that the untallied cost of jail can be sizable. More than 20 percent of jail costs were outside the jail budget in nearly a quarter of the surveyed jurisdictions.

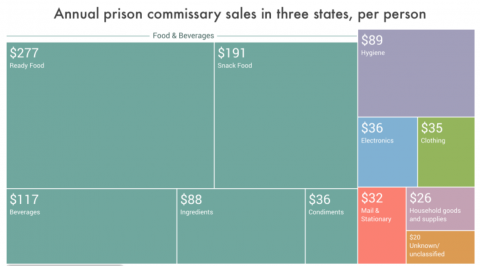
To bring some clarity to this bread-and-butter issue for incarcerated people, we analyzed commissary sales reports from state prison systems in Illinois, Massachusetts, and Washington. We chose these states because we were able to easily obtain commissary data, but conveniently, these three states also represent a decent cross section of prison systems, encompassing a variety of sizes and different types of commissary management.

We found that incarcerated people in these states spent more on commissary than our previous research suggested, and most of that money goes to food and hygiene products. We also discovered that even in state-operated commissary systems, private commissary contractors are positioned to profit, blurring the line between state and private control.

Our goal with this report is to give a hint as to how the criminal justice system works by identifying some of the key stakeholders and quantifying their “stake” in the status quo. Our visualization shows how wide and how deep mass incarceration and over-criminalization have spread into our economy. We find:

Statistics on revenue, expenditure, debt, and assets (cash and security holdings) for US governments. There are statistics for the 50 state areas and the District of Columbia, as well as a national summary.

Please read the accompanying documentation for the individual unit file before using these data. It can be found in the .zip file below.          

Insights From Fiscal 50’s Key Measures of State Fiscal Health

After years of slow progress, states benefited from a more promising economic and fiscal environment in 2018. Pressure on state finances eased somewhat as the second-longest economic recovery gained momentum and state tax revenue jumped, at least temporarily. Still, not all states have fully recovered from the shocks of the Great Recession more than a decade ago. Some are in a stronger position than others as they gauge how long the recovery will last.

The United States has the largest economy in the world at $20.4 trillion, according to data from the International Monetary Fund (IMF), which shows the US economy increased from around $19.4 trillion last year.
China follows, with $14 trillion, which is an increase of more than $2 trillion in comparison to 2017. Japan is in third place with an economy of $5.1 trillion, up from $4.87 trillion a year previously.

The world economy has strengthened as lingering fragilities related to the global financial crisis subside. In 2017, global economic growth reached 3%—the highest growth rate since 2011—and growth is expected to remain steady for the coming year.  The improved global economic situation provides an opportunity for countries to focus policy towards longer-term issues such as low carbon economic growth, reducing inequalities, economic diversification and eliminating deep-rooted barriers that hinder development.

This Notice publishes the annual determination of average cost of incarceration for the Fiscal Years (FY) 2016 and 2017. The fee to cover the average cost of incarceration for Federal inmates was $34,704.12 ($94.82 per day) in FY 2016 and $36,299.25 ($99.45 per day) in FY 2017. The average annual cost to confine an inmate in a Residential Re-entry Center was $29,166.54 ($79.69 per day) for FY 2016 and $32,309.80 ($88.52 per day) for FY 2017.

Annual GDP by state in 2018

Real GDP increased in 49 states and the District of Columbia in 2018. The percent change in real GDP ranged from 5.7 percent in Washington to -0.3 percent in Alaska. Information services; professional, scientific, and technical services; and durable goods manufacturing were the leading contributors to national economic growth in 2018. Information services and retail trade were the leading contributors to the increase in real GDP in Washington, the fastest growing state.


Other highlights

At a Glance

Each year, the Congressional Budget Office issues a set of long-term budget projections—that is, projections of what federal spending, revenues, deficits, and debt would be for the next 30 years if current laws generally did not change. This report is the latest in the series.