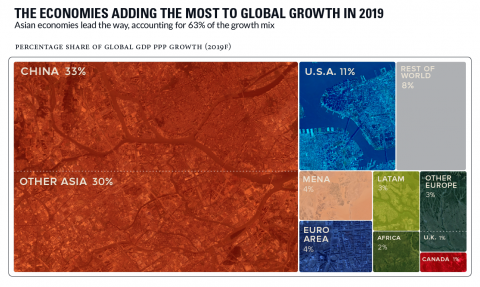
Economy

Global

Economic trends that provide information and resources globally, domestically, and within the field of corrections.

2018 and newer

Visualizing the Top 50 Most Valuable Global Brands

For many brands, it has been a devastating year to say the least.

Over half of the most valuable global brands have experienced a decline in brand value, a measure that takes financial projections, brand roles in purchase decisions, and strengths against competitors into consideration. But where some have faltered, others have asserted their dominance and stepped up for their customers like never before.


Near-term global financial stability risks have been contained as an unprecedented policy response to the coronavirus (COVID-19) pandemic has helped avert a financial meltdown and maintain the flow of credit to the economy. For the first time, many emerging market central banks have launched asset purchase programs to support the smooth functioning of financial markets and the overall economy. But the outlook remains highly uncertain, and vulnerabilities are rising, representing potential headwinds to recovery. The report presents an assessment of the real-financial disconnect, as well as forward-looking analysis of nonfinancial firms, banks, and emerging market capital flows. After the outbreak, firms’ cash flows were adversely affected as economic activity declined sharply.

Following its weakest performance since the global financial crisis, the world economy is poised for a modest rebound this year– if everything goes just right.

Hanging over this lethargic recovery are two other trends that raise questions about the course of economic growth: the unprecedented runup in debt worldwide, and the prolonged deceleration of productivity growth, which needs to pick up to bolster standards of living and poverty eradication.

Global growth is set to rise by 2.5% this year, a small uptick from 2.4% in 2019, as trade and investment gradually recover, the World Bank’s semi-annual Global Economic Prospects forecasts. Advanced economies are expected to slow as a group to 1.4% from 1.6%, mainly reflecting lingering weakness in manufacturing. 

The Global Competitiveness Report series has since its first edition aimed to prompt policy-makers beyond short term growth and to aim for long-run prosperity. The 2020 special edition is dedicated to elaborating on the priorities for recovery and revival, and considering the building blocks of a transformation towards new economic systems that combine “productivity”, “people” and “planet” targets.

Energy transition and the global economy

The global economy has suffered a significant slowdown amid prolonged trade disputes and wide-ranging policy uncertainties. While a slight uptick in economic activity is forecast for 2020, the World Economic Situation and Prospects 2020 warns that economic risks remain strongly tilted to the downside, aggravated by deepening political polarization and increasing scepticism over the benefits of multilateralism. These risks could inflict severe and long-lasting damage on development prospects. They also threaten to encourage a further rise in inward-looking policies, at a point when global cooperation is paramount.

The months after the release of the June 2020 World Economic Outlook (WEO) Update have offered a glimpse of how difficult rekindling economic activity will be while the pandemic surges. During May and June, as many economies tentatively reopened from the Great Lockdown, the global economy started to climb from the depths to which it had plunged in April. But with the pandemic spreading and accelerating in places, many countries slowed reopening, and some are reinstating partial lockdowns. While the swift recovery in China has surprised on the upside, the global economy’s long ascent back to pre-pandemic levels of activity remains prone to setbacks.

In 2019, state government revenues decreased 1.7 percent from the 2018 estimate of $2.71 trillion to $2.66 trillion. The major shares of revenue for state governments were taxes (40.6 percent), intergovernmental (26.6 percent), and insurance trust revenue (16.4 percent).

Global growth is projected at –4.9 percent in 2020, 1.9 percentage points below the April 2020 World Economic Outlook (WEO) forecast. The COVID-19 pandemic has had a more negative impact on activity in the first half of 2020 than anticipated, and the recovery is projected to be more gradual than previously forecast. In 2021 global growth is projected at 5.4 percent. Overall, this would leave 2021 GDP some 6½ percentage points lower than in the pre-COVID-19 projections of January 2020. The adverse impact on low-income households is particularly acute, imperiling the significant progress made in reducing extreme poverty in the world since the 1990s.

This site shows the monthly and quarterly US employment data from the U.S. Bureau of Labor Statistics (BLS) for 2020.

The COVID-19 pandemic is inflicting high and rising human costs worldwide, and the necessary protection measures are severely impacting economic activity. As a result of the pandemic, the global economy is projected to contract sharply by –3 percent in 2020, much worse than during the 2008–09 financial crisis. In a baseline scenario--which assumes that the pandemic fades in the second half of 2020 and containment efforts can be gradually unwound—the global economy is projected to grow by 5.8 percent in 2021 as economic activity normalizes, helped by policy support. The risks for even more severe outcomes, however, are substantial.

Real gross domestic product (GDP) increased in all 50 states and the District of Columbia in the fourth quarter of 2020, as real GDP for the nation increased at an annual rate of 4.3 percent, according to statistics released by the U.S. Bureau of Economic Analysis. The percent change in real GDP in the fourth quarter ranged from 9.9 percent in South Dakota to 1.2 percent in the District of Columbia (table 1).

Having a global pandemic steamroll its way through a state’s economy is no one’s good idea of enacting budgetary restraints. But facing reality is not optional. Texas has faced budget tightening in its corrections system before. So, legislators must address this situation in a similar fashion— by once again prioritizing finite resources while, this time, seeking to get a handle on a costly, aging prison population and reducing technical violations that undermine the entire purpose of community supervision in the first place.


Revenues received by the federal government in 2020 totaled $3.4 trillion, of which $1.6 trillion was receipts from individual income taxes.

Chances are that you believe you are in the middle class—nearly everyone in the United States does. Doctors and lawyers believe they are middle-class; so, too, do welders and waiters. In a 2015 Pew survey, only 10 percent of Americans said they considered themselves lower-class and just 1 percent thought they were upper-class.

Earnings have been flat or stagnant for many middle-class workers in the United States while health care, education, and housing costs are rising. Surveys show that Americans accurately perceive these pressures too and share a broad belief that the middle class is struggling. Seven in ten respondents to a Northwestern Mutual survey said that the middle class was staying the same or shrinking. One-third said the middle class might disappear entirely.

From the early 1970s into the new millennium, the U.S. prison population experienced unprecedented growth, which had a direct influence on state budgets. In recent years, however, lawmakers in nearly every state and from across the political spectrum have enacted new laws to reduce prison populations and spending. This report, which builds upon the information found in Vera’s 2012 publication The Price of Prisons: What Incarceration Costs Taxpayers, found that 13 states were successful in reducing both population and spending. However, no single reason explains a rise or fall in spending; instead, a multitude of factors push and pull expenditures in different directions. Read the report and explore our interactive data visualization below to learn more.

Jails are far more expensive than previously understood, as significant jail expenditures—such as employee benefits, health care and education programs for incarcerated people, and general administration—are often not reflected in jail budgets, but rather in other county agencies. This report surveys 35 jail jurisdictions in 18 states to tally the actual price of their jails—and discovered that the untallied cost of jail can be sizable. More than 20 percent of jail costs were outside the jail budget in nearly a quarter of the surveyed jurisdictions.

To bring some clarity to this bread-and-butter issue for incarcerated people, we analyzed commissary sales reports from state prison systems in Illinois, Massachusetts, and Washington. We chose these states because we were able to easily obtain commissary data, but conveniently, these three states also represent a decent cross section of prison systems, encompassing a variety of sizes and different types of commissary management.

We found that incarcerated people in these states spent more on commissary than our previous research suggested, and most of that money goes to food and hygiene products. We also discovered that even in state-operated commissary systems, private commissary contractors are positioned to profit, blurring the line between state and private control.

Our goal with this report is to give a hint as to how the criminal justice system works by identifying some of the key stakeholders and quantifying their “stake” in the status quo. Our visualization shows how wide and how deep mass incarceration and over-criminalization have spread into our economy. We find:

Statistics on revenue, expenditure, debt, and assets (cash and security holdings) for US governments. There are statistics for the 50 state areas and the District of Columbia, as well as a national summary.

Please read the accompanying documentation for the individual unit file before using these data. It can be found in the .zip file below.          

Some states shine in health care. Some soar in education. Some excel in both – or in much more. The Best States ranking of U.S. states draws on thousands of data points to measure how well states are performing for their citizens. In addition to health care and education, the metrics take into account a state’s economy, its roads, bridges, internet and other infrastructure, its public safety, the fiscal stability of state government, and the opportunity it affords its residents.

Following a political standoff that briefly delayed his annual speech to the nation, President Donald Trump will deliver his second State of the Union address on Tuesday night. The speech comes amid a debate between Trump and congressional Democrats over border security – one that recently led to the longest federal government shutdown in history.

As Trump’s speech takes the spotlight, here’s a look at public opinion on important issues facing the country, drawn from Pew Research Center’s recent surveys.

The U.S. economy has been on a long, slow upward trend for eight years, but a Cornell economist predicts that – like all good things – the steady growth will soon come to an end, likely by the end of the year.

It won’t be a disastrous scenario like the 2009 recession, but rather a garden-variety reaction to the Federal Reserve raising interest rates and, in turn, interest-sensitive sectors cooling off, he said.

This site shows the monthly and quarterly US employment data from the U.S. Bureau of Labor Statistics (BLS) for 2019.

Title 28 of the Code of Federal Regulations, part 505, allows for assessment of a fee to cover the average cost of incarceration for Federal inmates. We calculate the cost of incarceration fee (COIF) by dividing the number representing the Bureau of Prisons (Bureau) facilities' monetary obligation (excluding activation costs) by the number of inmate-days incurred for the fiscal year, and then by multiplying the quotient by the number of days in the fiscal year. Based on FY 2018 data, FY 2018 COIF was $37,449.00 ($102.60 per day) for Start Printed Page 63892Federal inmates in Bureau facilities and $34,492.50 ($94.50 per day) for Federal inmates in Community Corrections Centers.