Population

Global

Population demographics trends that provide information and resources globally, domestically, and within the field of corrections.

2018 and newer

Today the U.S. Census Bureau is releasing results from the 2020 Census, marking the 24th time the nation’s population has been counted since the first census in 1790, when there were just 3.9 million people living in the United States.

The first census helped build the foundation of our democracy, and the census continues to be a cornerstone for our growing nation.

According to the 2020 Census, there were 331,449,281 people living in the United States as of April 1, 2020, which represents a growth of 7.4% since 2010. In the last 100 years, our nation has tripled in size.

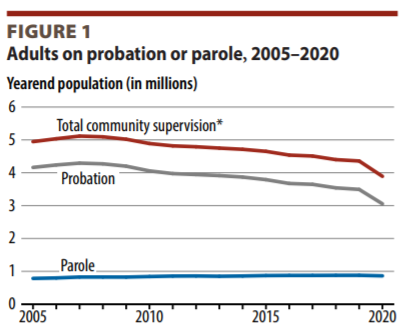
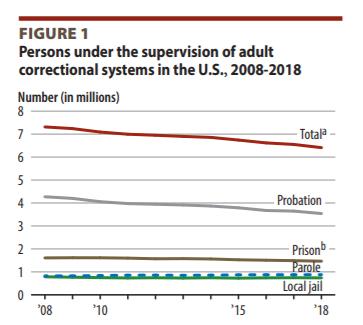
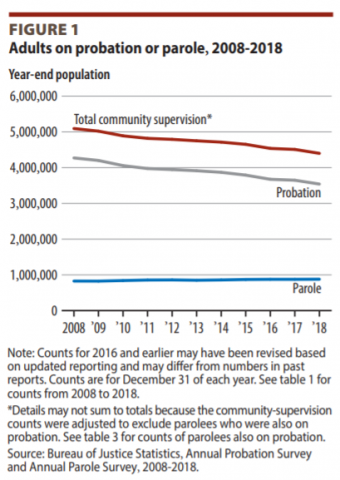
An estimated 3,890,400 adults were under community supervision at yearend 2020, which was a 6.6% decline from the 4,167,100 who were supervised in the community on January 1, 2020. This decline was solely driven by a reduction in people on probation, who made up the majority (79%) of the community supervision population. During 2020, the number of people on probation decreased from 3,330,200 to 3,053,700 (down 8.3%), the largest annual decline since the Bureau of Justice Statistics (BJS) began the probation collection in 1980. The number of adults on parole increased 1.3% during 2020, from 851,000 on January 1, 2020 to 862,100 at yearend. Among all adult U.S. residents, 1 in 66 were supervised in the community at yearend 2020.

The year 2030 marks a demographic turning point for the United States. Beginning that year, all baby boomers will be older than 65 years of age. This will expand the size of the older population so that one in every five Americans is projected to be of retirement age. Later that decade, by 2034, we project that older adults will outnumber children for the first time in U.S. history. The year 2030 marks another demographic first for the United States. That year, because of population aging, immigration is projected to overtake natural increase (the excess of births over deaths) as the primary driver of population growth for the country.
 

This entry gives an estimate from the US Bureau of the Census based on statistics from population censuses, vital statistics registration systems, or sample surveys pertaining to the recent past and on assumptions about future trends. The total population presents one overall measure of the potential impact of the country on the world and within its region. Note: Starting with the 1993 Factbook, demographic estimates for some countries (mostly African) have explicitly taken into account the effects of the growing impact of the HIV/AIDS epidemic.

Population in the world is currently (2020) growing at a rate of around 1.05% per year (down from 1.08% in 2019, 1.10% in 2018, and 1.12% in 2017). The current average population increase is estimated at 81 million people per year.

Annual growth rate reached its peak in the late 1960s, when it was at around 2%. The rate of increase has nearly halved since then, and will continue to decline in the coming years.

World population will therefore continue to grow in the 21st century, but at a much slower rate compared to the recent past. World population has doubled (100% increase) in 40 years from 1959 (3 billion) to 1999 (6 billion). It is now estimated that it will take another nearly 40 years to increase by another 50% to become 9 billion by 2037.

Published since 1962, PRB’s annual World Population Data Sheet tracks global population data. This year’s edition provides 24 population indicators for more than 200 countries and territories. Users can also explore key trends through an interactive map.

“As the experience with the COVID-19 pandemic has shown us, population changes such as aging and rapid urbanization are important factors for countries to consider as they plan for future disease outbreaks, long-term health care needs and other developments,” said Jeff Jordan, PRB president and CEO. “PRB’s World Population Data Sheet provides objective data and analysis policymakers need to make these decisions.”

Among the key findings for 2020:

The federal prison population, which declined for the first time in decades under President Barack Obama, fell further during the administration of President Donald Trump.

Can it really be true that most people in jail are being held before trial? And how much of mass incarceration is a result of the war on drugs? These questions are harder to answer than you might think, because our country’s systems of confinement are so fragmented. The various government agencies involved in the justice system collect a lot of critical data, but it is not designed to help policymakers or the public understand what’s going on. As public support for criminal justice reform continues to build, however, it’s more important than ever that we get the facts straight and understand the big picture.

The nation’s imprisonment rate is at its lowest level in more than two decades. The greatest decline has come among black Americans, whose imprisonment rate has decreased 34% since 2006.

There were 1,501 black prisoners for every 100,000 black adults at the end of 2018, according to a new report from the Bureau of Justice Statistics (BJS), the statistical agency of the U.S. Justice Department. That was down sharply from 2,261 black inmates per 100,000 black adults at the end of 2006, according to an earlier BJS study. These statistics only count inmates sentenced to more than a year in state or federal prison. They exclude inmates held in local jails and those sentenced to shorter periods of imprisonment.

This report is the 94th in a series that began in 1926. It provides counts of prisoners under the jurisdiction of state and federal correctional authorities in 2019 and includes findings on admissions, releases, and imprisonment rates. It describes demographic and offense characteristics of state and federal prisoners.

The United States has more immigrants than any other country in the world. Today, more than 40 million people living in the U.S. were born in another country, accounting for about one-fifth of the world’s migrants. The population of immigrants is also very diverse, with just about every country in the world represented among U.S. immigrants.

Pew Research Center regularly publishes statistical portraits of the nation’s foreign-born population, which include historical trends since 1960. Based on these portraits, here are answers to some key questions about the U.S. immigrant population.

How many people in the U.S. are immigrants?

This report is the 32nd in a series that began in 1982. It provides statistics based on BJS's Annual Survey of Jails and Census of Jail Inmates. It describes the number of inmates held in local jails, jail incarceration rates, demographic characteristics of jail inmates, number of admissions to jail, jail capacity, inmate turnover rates, and staff employed in local jails.

The coronavirus outbreak has pushed millions of Americans, especially young adults, to move in with family members. The share of 18- to 29-year-olds living with their parents has become a majority since U.S. coronavirus cases began spreading early this year, surpassing the previous peak during the Great Depression era.

This report is the 23rd in a series that began in 1985. It provides statistics on populations supervised by adult correctional systems in the United States, including persons held in prisons or jails and those supervised in the community on probation or parole. It provides statistics on the size of the correctional populations at year-end 2017 and year-end 2018, and changes in populations over time.

The statistic shows the global population as of mid-2020, sorted by age. In mid-2020, approximately 23.7 percent of the global population were aged between 10 and 24 years.

This report is the 27th in a series that began in 1980. It provides national data on the adult population on probation or parole in 2017 and 2018. It describes trends in the overall community-supervision population and annual changes in probation and parole populations.

In 2020, the COVID-19 pandemic affected drastically all forms of human mobility, including international migration. Around the globe, the closing of national borders and severe disruptions to international travel obliged hundreds of thousands of people to cancel or delay plans of moving abroad. Hundreds of thousands of migrants were stranded, unable to return to their countries, while others were forced to return to their home countries earlier than planned, when job opportunities dried up and schools closed.

The U.S. population clock is based on a series of short-term projections for the resident population of the United States. This includes people whose usual residence is in the 50 states and the District of Columbia. These projections do not include members of the Armed Forces overseas, their dependents, or other U.S. citizens residing outside the United States.

The projections are based on a monthly series of population estimates starting with the April 1, 2010 resident population from the 2010 Census.

QuickFacts provides statistics for all states and counties, and for cities and towns with a population of 5,000 or more.

Value Notes

Estimates are not comparable to other geographic levels due to methodology differences that may exist between different data sources.

County and city jails in the United States held 738,400 inmates at midyear 2018 (table 1), a decline of 6% from 785,500 inmates held in 2008. The midyear population remained relatively stable from 2011 to 2018. At midyear 2018, about one-third of jail inmates (248,500) were sentenced or awaiting sentencing on a conviction, while about two-thirds (490,000) were awaiting court action on a current charge or were held for other reasons. Over the 10-year period from 2008 to 2018, the rate of incarceration in local jails dropped by 12%, from 258 inmates per 100,000 U.S. residents to 226 per 100,000 (fgure 1). During this period, the jail incarceration rate increased by 12% for whites and declined by about 30% for blacks (28%) and Hispanics (33%).

Over the course of the nation’s history, there has been a slow but steady decrease in the size of the average U.S. household—from 5.79 people per household in 1790 to 2.58 in 2010. But this decade will likely be the first since the one that began in 1850 to break this long-running trend, according to newly released Census Bureau data. In 2018 there were 2.63 people per household.

From the end of 2017 to the end of 2018, the total prison population in the United States declined from 1,489,200 to 1,465,200, a decrease of 24,000 prisoners. Tis was a 1.6% decline in the prison population and marked the fourth consecutive annual decrease of at least 1%. Te combined federal and state imprisonment rate, based on sentenced prisoners (those sentenced to more than one year), fell 2.4% from 2017 to 2018, declining from 441 to 431 prisoners per 100,000 U.S. residents. Across a decade, the imprisonment rate—the proportion of U.S. residents who are in prison—fell 15%, from 506 sentenced prisoners in 2008 to 431 in 2018 per 100,000 U.S. residents (fgure 1).

Cities with fewer than 200,000 residents grew faster than larger metropolises between 2017 and 2018 as high housing prices chased many people away from big cities and their closest suburbs.

The biggest cities grew by a collective 326,000 people, less than half the number earlier in the decade, and less than the number for smaller cities — 421,000 for cities with populations between 10,000 and 50,000.

An estimated 4,537,100 adults were under community supervision as of December 31, 2016 (year-end), a decline of 1.1% from 4,586,900 on January 1, 2016 (figure 1 and table 1).* An estimated one in 55 adults in the United States were under community supervision at year-end 2016. Persons on probation accounted for the majority (81%) of adults under community supervision. The decline observed in the adult community corrections population in 2016 was the result of a decrease in the probation population. The probation population declined 1.4%, from an estimated 3,725,600 offenders on January 1, 2016, to 3,673,100 at year-end 2016 (figure 2). The parole population continued to grow, increasing by 0.5%, from 870,500 persons at year-end 2015