CES: Printable & Archival Versions

By default, you are seeing this year's Corrections Environmental Scan. To see previous years' scans, simply enter the year (starting from 2017) that you would like to see, then click the Apply button.

It's also possible to filter the results by choosing options from the Perspective and Type dropdowns. Choosing these options will update the cover image to reflect the choice(s) that were made.

Print Advisory: The cover page background image may not print based on your browser's print settings defaulting to hide background colors and images. For best print results, we suggest using Chrome. The rest of the document will print as designed.

Print

FIRST STEP Act of 2018 (P.L. 115- 391)

On December 21, 2018, President Trump signed into law the First Step Act of 2018 (P.L. 115- 391). The act was the culmination of several years of congressional debate about what Congress might do to reduce the size of the federal prison population while also creating mechanisms to maintain public safety. This report provides an overview of the provisions of the act.

The act has three major components: (1) correctional reform via the establishment of a risk and needs assessment system at the Bureau of Prisons (BOP), (2) sentencing reform via changes to penalties for some federal offenses, and (3) the reauthorization of the Second Chance Act of 2007 (P.L. 110-199). The act also contains a series of other criminal justice-related provisions. 

The First Step Act requires the Department of Justice (DOJ) to develop a risk and needs assessment system to be used by BOP to assess the recidivism risk of all federal prisoners and to place prisoners in programs and productive activities to reduce this risk. Prisoners who successfully complete recidivism reduction programming and productive activities can earn additional time credits that will allow them to be placed in prerelease custody (i.e., home confinement or a Residential Reentry Center) earlier than they were previously allowed. The act prohibits prisoners convicted of any one of dozens of offenses from earning additional time credits, though these prisoners can earn other benefits, such as additional visitation time, for successfully completing recidivism reduction programming. Offenses that make prisoners ineligible to earn additional time credits can generally be categorized as violent, terrorism, espionage, human trafficking, sex and sexual exploitation, repeat felon in possession of firearm, certain fraud, or high-level drug offenses. 

World Population Data (2018)

  • The population of 26 countries, nearly all in Africa, will at least double. Niger in West Africa will see its population nearly triple.
  • A total of 38 countries will have smaller populations in 2050 than in 2018. China will register the largest numerical population decrease―about 50 million―followed by Japan at 25 million and Russia at 9.4 million. Romania will see the largest percentage decline in population (23 percent).
  • The population of the United States will reach 390 million, up from 328 million in 2018.
  • China’s population will decrease by about 50 million from its current size to 1.34 billion. India will supplant China as the world’s most populous country with 1.68 billion people.
  • Nigeria will become the third most populous country as its population rises to 411 million, up 109 percent from 2018. Nigeria is currently the seventh most populous country.


  • The world population will reach 9.9 billion in 2050, up 29 percent or 2.3 billion from an estimated 7.6 billion now.
  • Africa’s population will more than double by 2050 to 2.6 billion and the continent will account for 58 percent of the global population increase between 2018 and 2050.
  • By 2050, the number of people in Asia will rise about 717 million to 5.3 billion, while Europe (including Russia) will see a decline in population from 746 million to 730 million. The population in the Americas is seen increasing to 1.2 billion from 1 billion now.
  • The population of 26 countries, nearly all in Africa, will at least double by 2050. The population of Niger in West Africa will nearly triple.
  • The population of 38 countries will be smaller in 2050 than in 2018. The biggest numerical decrease will be in China (about 50 million) and the biggest percentage decrease in Romania (around 22 percent).


  • The 2018 worldwide total fertility rate (TFR) is 2.4. The global TFR has been declining but remains high enough to drive continued global population growth. Niger has the highest TFR at 7.2; South Korea the lowest at 1.1.
  • As the global population increases, continued declines in fertility and mortality mean that the world population’s shift toward an older age structure (known as population aging) will accelerate.
  • PRB projects that 16 percent of the world population will be ages 65+ by 2050, up from 9 percent in 2018, and 5 percent in 1960. The segment ages 85+ is growing the fastest among this age group.
  • The share of children (ages <15) in the world population has been falling and will continue to fall, from 37 percent in 1960, to 26 percent in 2018, and a projected 21 percent by 2050.
  • Age structures, as well as the timing and speed of age structure change, vary by country and have implications for national policy agendas and resource allocation.

2018 Revision of World Urbanization Prospects

Today, 55% of the world’s population lives in urban areas, a proportion that is expected to increase to 68% by 2050. Projections show that urbanization, the gradual shift in residence of the human population from rural to urban areas, combined with the overall growth of the world’s population could add another 2.5 billion people to urban areas by 2050, with close to 90% of this increase taking place in Asia and Africa, according to a new United Nations data set launched today.

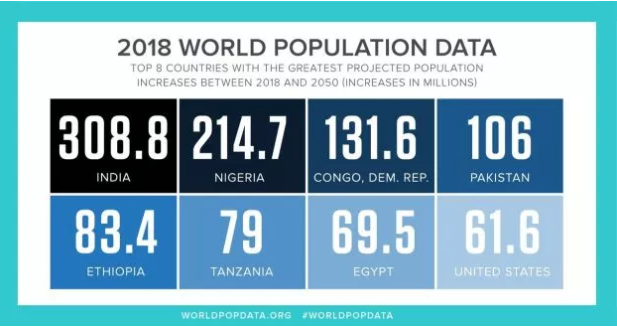
The 2018 Revision of World Urbanization Prospects produced by the Population Division of the UN Department of Economic and Social Affairs (UN DESA) notes that future increases in the size of the world’s urban population are expected to be highly concentrated in just a few countries. Together, India, China and Nigeria will account for 35% of the projected growth of the world’s urban population between 2018 and 2050. By 2050, it is projected that India will have added 416 million urban dwellers, China 255 million and Nigeria 189 million.

The urban population of the world has grown rapidly from 751 million in 1950 to 4.2 billion in 2018. Asia, despite its relatively lower level of urbanization, is home to 54% of the world’s urban population, followed by Europe and Africa with 13% each.

Today, the most urbanized regions include Northern America (with 82% of its population living in urban areas in 2018), Latin America and the Caribbean (81%), Europe (74%) and Oceania (68%). The level of urbanization in Asia is now approximating 50%. In contrast, Africa remains mostly rural, with 43% of its population living in urban areas.

Population decline in some cities and in rural areas 

Some cities have experienced population decline in recent years. Most of these are located in the low-fertility countries of Asia and Europe where overall population sizes are stagnant or declining. Economic contraction and natural disasters have also contributed to population losses in some cities.

A few cities in Japan and the Republic of Korea (for example, Nagasaki and Busan) have experienced population decline between 2000 and 2018. Several cities in countries of Eastern Europe, such as Poland, Romania, the Russian Federation and Ukraine, have lost population since 2000 as well.  In addition to low fertility, emigration has contributed to the lower population size in some of these cities. Globally, fewer cities are projected to see their populations decline from today until 2030, compared to what has occurred during the last two decades.

The rural population of the world has grown slowly since 1950 and is expected to reach its peak in a few years. The global rural population is now close to 3.4 billion and is expected to rise slightly and then decline to 3.1 billion by 2050. Africa and Asia are home to nearly 90% of the world’s rural population in 2018. India has the largest rural population (893 million), followed by China (578 million).

Cities ranking and mega cities

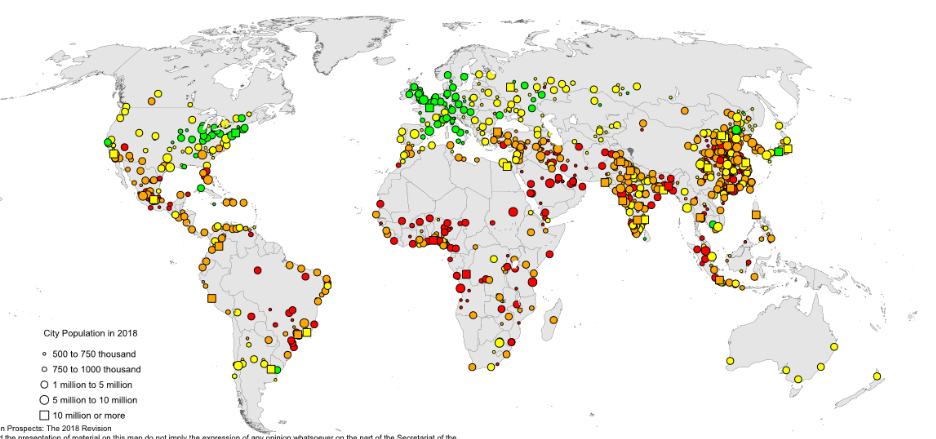
Tokyo is the world’s largest city with an agglomeration of 37 million inhabitants, followed by New Delhi with 29 million, Shanghai with 26 million, and Mexico City and São Paulo, each with around 22 million inhabitants. Today, Cairo, Mumbai, Beijing and Dhaka all have close to 20 million inhabitants. By 2020, Tokyo’s population is projected to begin to decline, while Delhi is projected to continue growing and to become the most populous city in the world around 2028.

By 2030, the world is projected to have 43 megacities with more than 10 million inhabitants, most of them in developing regions. However, some of the fastest-growing urban agglomerations are cities with fewer than 1 million inhabitants, many of them located in Asia and Africa. While one in eight people live in 33 megacities worldwide, close to half of the world’s urban dwellers reside in much smaller settlements with fewer than 500,000 inhabitants.

2018 Update On Prisoner Recidivism: A 9-Year Follow-Up Period (2005-2014)

This report examines the recidivism patterns of former prisoners during a 9-year follow-up period. The report provides data on the number and types of crimes prisoners commit after release, by offender characteristics, commitment offense, whether the arrest was within or outside the state of release, and whether released prisoners had no subsequent arrests during the follow-up period. It also shows how recidivism and desistance patterns change when using longer or shorter follow-up periods, including cumulative and annual arrest percentages, year of first arrest following release from prison, and the total number of arrests of released prisoners. Findings are based on data from BJS's Recidivism Study of State Prisoners Released in 2005 data collection, which tracked a sample of former prisoners from 30 states for 9 years following release in 2005. Source data are from prisoner records reported by state departments of corrections to BJS's National Corrections Reporting Program and national criminal history records from the FBI's Interstate Identification Index and state criminal history repositories via the International Justice and Public Safety Network.

Highlights:

  • The 401,288 state prisoners released in 2005 had 1,994,000 arrests during the 9-year period, an average of 5 arrests per released prisoner. Sixty percent of these arrests occurred during years 4 through 9.
  • An estimated 68% of released prisoners were arrested within 3 years, 79% within 6 years, and 83% within 9 years.
  • Eighty-two percent of prisoners arrested during the 9-year period were arrested within the first 3 years.
  • Almost half (47%) of prisoners who did not have an arrest within 3 years of release were arrested during years 4 through 9.
  • Forty-four percent of released prisoners were arrested during the first year following release, while 24% were arrested during year-9.

7 demographic trends shaping the U.S. and the world in 2018

  • Millennials are projected to outnumber Baby Boomers next year.
  • A record number of Americans live in multigenerational households, part of a broader trend toward more shared living.
  • The institution of marriage continues to change.
  •  After decades of decline, motherhood and family size are ticking up in the U.S.
  • There are more than 250 million migrants worldwide.
  • New refugee arrivals are down in the U.S. and their religious composition has changed.
  • International arrivals to the U.S. have risen among some groups.

Annual Determination of Average Cost of Incarceration 2018

This Notice publishes the annual determination of average cost of incarceration for the Fiscal Years (FY) 2016 and 2017. The fee to cover the average cost of incarceration for Federal inmates was $34,704.12 ($94.82 per day) in FY 2016 and $36,299.25 ($99.45 per day) in FY 2017. The average annual cost to confine an inmate in a Residential Re-entry Center was $29,166.54 ($79.69 per day) for FY 2016 and $32,309.80 ($88.52 per day) for FY 2017.

Annual Survey of Public Employment & Payroll (ASPEP)

Content

The survey provides state and local government data on full-time and part-time employment, part-time hours worked, full-time equivalent employment, and payroll statistics by governmental function (i.e., elementary and secondary education, higher education, police protection, fire protection, financial administration, central staff services, judicial and legal, highways, public welfare, solid waste management, sewerage, parks and recreation, health, hospitals, water supply, electric power, gas supply, transit, natural resources, correction, libraries, air transportation, water transport and terminals, other education, state liquor stores, social insurance administration, and housing and community development).

The survey provides Federal Government data on total employees, full-time employees, and total March payroll by governmental function. There is no detail available for part-time employment, part-time hours worked, full-time equivalent, or full-time or part-time employee payrolls. Three functions apply only to the Federal Government and have no counterpart at the state and local government levels: national defense and international relations, postal service, and space research and technology.

How Data Are Used

 The U.S. Congress, federal agencies, state and local governments, educational and research organizations, and the general public employ these results. Some major uses include the following:

  • Development of the government component of the gross domestic product estimates
  • Development of the national income accounts
  • Development of personal income figures for state and county areas
  • Allocation of certain federal grant funds
  • Legislative research
  • Wage and salary negotiations by state and local governments
  • Comparative studies of state and local government employment

Artificial Intelligence

Digital life is augmenting human capacities and disrupting eons-old human activities. Code-driven systems have spread to more than half of the world’s inhabitants in ambient information and connectivity, offering previously unimagined opportunities and unprecedented threats. As emerging algorithm-driven artificial intelligence (AI) continues to spread, will people be better off than they are today?

Some 979 technology pioneers, innovators, developers, business and policy leaders, researchers and activists answered this question in a canvassing of experts conducted in the summer of 2018.

The experts predicted networked artificial intelligence will amplify human effectiveness but also threaten human autonomy, agency and capabilities. They spoke of the wide-ranging possibilities; that computers might match or even exceed human intelligence and capabilities on tasks such as complex decision-making, reasoning and learning, sophisticated analytics and pattern recognition, visual acuity, speech recognition and language translation. They said “smart” systems in communities, in vehicles, in buildings and utilities, on farms and in business processes will save time, money and lives and offer opportunities for individuals to enjoy a more-customized future.

To read the full article, follow the link in the citation below.

Capital Punishment, 2016

This report includes data on persons under sentence of death, persons executed, and the status of the death penalty at the state and federal level. Data on prisoners under sentence of death were obtained from the department of corrections in each jurisdiction that authorized the death penalty on December 31, 2016. Information on the status of death penalty statutes was obtained from the office of the Attorney General in each of the 50 states, the District of Columbia, and the federal government.

At year-end 2016, 34 states and the federal government authorized the death penalty. Two of these states (New York and Wyoming) did not have any prisoners under sentence of death at year end. Each jurisdiction determines the offenses for which the death penalty can be imposed (appendix tables 1 and 2). Once a person has been convicted of a capital offense, a separate sentencing hearing is held. During the sentencing hearing, a jury will consider aggravating and mitigating factors as defined by state law. Before a person can be sentenced to death, a jury must find that at least one aggravating factor is present and that mitigating factors don’t outweigh the aggravating factor(s).

Highlights

  • At year-end 2016, a total of 32 states and the Federal Bureau of Prisons (BOP) held 2,814 prisoners under sentence of death, which was 58 (2%) fewer than at year-end 2015.
  • California (26%), Florida (14%), and Texas (9%) held nearly half (49%) of the nation’s prisoners under sentence of death at year-end 2016; in 2016, Texas executed seven prisoners, Florida executed one, and California did not execute any prisoners.
  • In 2016, the number of prisoners under sentence of death decreased for the sixteenth consecutive year.
  • Twelve states received a total of 32 prisoners under sentence of death in 2016.
  • Five states executed a total of 20 prisoners in 2016, with Georgia (9) and Texas (7) accounting for 80% of executions.
  • The number of prisoners executed in 2016 represented the smallest number of executions since 1991, when 14 prisoners were executed.
  • Of the 20 prisoners executed, 18 were white (2 of Hispanic origin) and 2 were black.
  • Seventeen states and the BOP removed 70 prisoners from under sentence of death by means other than execution.
  • At year-end 2016, 13 states and the BOP held fewer prisoners under sentence of death than a year earlier, 4 states held more prisoners, and 16 states held the same number.
  • The largest decline in prisoners under sentence of death occurred in Georgia (down 10 prisoners), followed by Louisiana (down 9) and Florida, Pennsylvania, and Texas (down 7 each).
  • The largest increase in the number of prisoners under sentence of death occurred in North Carolina and California (up 3 each), followed by Ohio (up 2), and Nevada (up 1).
  • Among prisoners under sentence of death at year-end 2016, a total of 55% were white and 42% were black.
  • At year-end 2016, among the 2,553 prisoners under sentence of death whose ethnic origin was known, a total of 378 prisoners (15%) were Hispanic.
  • Ninety-eight percent of prisoners under sentence of death were male.

Compendium of United Nations standards and norms in crime prevention and criminal justice

The  Compendium of United Nations standards and norms in crime prevention and criminal justice contains the instruments in the area of crime prevention and criminal justice adopted  by the international community in more than sixty years. 

Over the years a considerable body of United Nations standards and norms related to crime prevention and criminal justice has emerged, covering a wide variety of issues such as justice for children, the treatment of offenders, international cooperation, good governance, victim protection and violence against women. 
The standards and norms have made a significant contribution to promoting more effective and fair criminal justice structures in three dimensions. Firstly, they can be utilized at the national level by fostering in-depth assessments leading to the adoption of necessary criminal justice reforms. Secondly, they can help countries to develop subregional and regional strategies. Thirdly, globally and internationally, the standards and norms represent "best practices" that can be adapted by States to meet national needs. 
The first edition of the  Compendium was published in 1992. The second edition was issued in 2006. The present edition of the Compendium includes a number of new standards and norms that have been developed in the areas of treatment of prisoners, women offenders, legal aid, judicial integrity, justice for children and violence against women, as well as the declarations of the most recent United Nations congresses on crime prevention and criminal justice. 

This updated version of the  Compendium has been structured in five parts: 
1.    Persons in custody, non-custodial sanctions and restorative justice 
2.    Justice for children 
3.    Crime prevention, violence against women and victim issues 
4.    Good governance, the independence of the judiciary, the integrity of criminal justice personnel and access to legal aid 
5.    Legal, institutional and practical arrangements for international cooperation 

It is hoped that this updated version of the  Compendium will contribute to a wider awareness and dissemination of the United Nations standards and norms in crime prevention and criminal justice and, consequently, will reinforce the respect for the rule of law and human rights in the administration of justice. 
The following files are in Portable Document Format (pdf). 

Crime in 2018: Updated Analysis

In September, the Brennan Center analyzed available crime data from the nation's 30 largest cities, estimating that these cities would see a decline in crime and murder in 2018. Our report, Crime and Murder in 2018: A Preliminary Analysis, concluded that crime and murder in 2018 are again declining nationwide, continuing the historic downward trend.

This analysis updates the September report and finds that, where data were available, rates of crime, violent crime, and murder in major American cities are estimated to decline through the end of 2018. However, murder rates in some cities remain above 2015 levels, demonstrating a continued need for evidence-based solutions to violent crime.

This report's main findings are:

  • Murder: The 2018 murder rate in the 30 largest cities is estimated to decline by nearly 6 percent. Large decreases this year in Chicago and San Francisco, as well as moderate decreases in other cities such as Baltimore, contributed to this decline. The murder rate in Chicago — which increased significantly in 2015 and 2016 — is projected to decline by 18.1 percent in 2018. The murder rate in San Francisco is estimated to fall by nearly 27 percent. Baltimore’s 2018 murder rate is projected to decline by 7.4 percent. Some cities are projected to see their murder rates rise, including Washington, D.C. (by 39.5 percent), and Houston (by 22.6 percent). Further study is needed to better understand the causes of these rises.
  • Crime: The overall crime rate in the 30 largest cities in 2018 is estimated to decline slightly from the previous year, falling by 1.8 percent. While this conclusion is based on preliminary data, if the trend holds, the crime rate will fall to its lowest since at least 1990.
  • Violent Crime: Violent crime rates are projected to decline in the majority of the 30 largest cities through the end of 2018. Overall, the violent crime rate is estimated to decrease by 2.7 percent, continuing a downward trend from 2017.

Estimates of crime and violent crime are based on data from 22 of the nation’s 30 largest cities; estimates of murder include data from all 30 cities. While the estimates in this report are based on early data, previous Brennan Center reports have correctly estimated the direction and magnitude of changes in major-city crime rates.

Decarceration Strategies: How 5 States Achieved Substantial Prison Population Reductions

FIVE KEY STRATEGIES AND PRACTICES THAT REDUCED PRISON POPULATIONS
1. Measures to Get Justice Reforms Underway and Maintain Momentum
• High-profile leadership, bipartisanship and inter-branch collaboration (all 5 states).
• Leveraging outside technical assistance and research findings on evidence-based practices (all 5 states).
• Community engagement as a foundation of successful reentry and community reintegration (CT, MI, RI).
• Pilots or staged implementation as innovation incubators (CT, MI).
2. Decreased Prison Admissions via Fewer New Prison Commitments
• Crime reduction helped in all 5 states – but reduced crime is no guarantee of less imprisonment.
• Reductions in criminal penalties or adjusting penalties according to seriousness (all 5 states).
• Elimination of various mandatory minimum sentences, sometimes retroactively (CT, MI, RI, SC).
• Creation or expansion of specialty courts and/or other alternatives to incarceration (CT, MI, MS, SC).
• Modifications of responses to at-risk youth to disrupt school-to-prison pipeline (CT, SC).
3. Decreased Prison Admissions via Reduced Incarceration for Failure on Community Supervision
• Implementation of graduated intermediate sanctions for non-criminal violations (CT, MI, MS, SC).
• Engagement with community service providers and employers before release from prison (CT, MI, RI).
• State and local collaboration regarding case management and supervision (CT, MI, RI).
• Greater focus on intermediate outcomes (CT, MI, RI).
• Imposition of shorter terms of community supervision (MS, RI, SC).
4. Increased Prison Releases via Increasing the Feasibility and/or Efficiency Of Release
• Incorporation of dynamic risk and needs assessment into justice processes (all 5 states).
• Inclusion of releasing authorities in planning/implementation (CT, MI, RI, SC).
• Expanded initiatives to overcome barriers to the feasibility of release (CT, MI, RI, SC).
• Conditional release approval earlier in the process before eligibility for release (CT, MI, RI).
• Feedback to releasing authorities regarding outcomes to build trust in reentry (CT, MI, RI).
• Centralized reentry planning, trained specialists, and a goal of release at first opportunity (CT, MI, MS).
• Simplified and/or expedited release processing especially when backlogs in processing (CT, MI, RI).
5. Increased Prison Releases via Requiring Less Time Served Before Eligibility for Release
• Allowance or expansion of sentence credits through a variety of measures (CT, MS, RI, SC).
• Reduction of criminal penalties even though still prison-bound (CT, MI, SC).
• Modifications to sentence enhancements for aggravating factors (MS, SC).
• Reductions in time served prior to eligibility for repeat paroles after revocation (MI, MS).

Driverless Cars Are a Tough Sell to Americans

STORY HIGHLIGHTS

  • 75% would use own human-operated car even if driverless cars were common
  • 52% say they would never want to use a self-driving car
  • 34% personally enjoy driving "a great deal"; 44% "a moderate amount"

These findings are from an April 23-29 Gallup poll that explored Americans' driving habits and their attitudes toward cars -- both human-operated and driverless. While majorities of all demographic groups say they would want to own or lease a car that they personally drive even when self-driving cars are common, there were several notable differences among subgroups.

  • Those who do not enjoy driving much or at all (36%) are three times as likely as those who enjoy driving a great deal (11%) to say they would own a driverless car.
  • College graduates (29%) are more than twice as likely as those who are not college graduates (13%) to say they would own a self-driving car.
  • Americans living in cities (23%) and suburbs (24%) are more than twice as likely as those living in small towns and rural areas (10%) to say they would own a driverless car.


Emerging Technology Trends and Their Impact on Criminal Justice

Key Findings

  1. The criminal-justice arena faces an abundance of information technology opportunities. However, important barriers, including a lack of business cases; a lack of implementation plans and procedures; and a lack of security, privacy, and civil-rights protections, hinder its ability to take advantage of those opportunities.
  2. Agencies need to develop business cases and common processes for implementing new technologies.
  3. Research is needed to improve sharing of criminal-justice technology among practitioners and researchers.
  4. To prevent misuse of new technologies, security, privacy, and civil-rights protections need to be incorporated into common processes for implementing those technologies.
  5. Materials need to be developed to educate the public about emerging criminal-justice technologies.
  6. Research is needed on changing organizational cultures to better support field-wide information-sharing and safeguarding.
  7. The technologies and practices with the most potential for improving both public safety and community relations need to be identified.
  8. Unintended consequences of new technologies must be assessed.

Federal Justice Statistics, 2015-2016

This report describes persons processed by the federal criminal justice system. Data are from the Federal Justice Statistics Program (FJSP). The FJSP collects, standardizes, and reports on administrative data received from six federal justice agencies: the U.S. Marshals Service, Drug Enforcement Administration, Executive Office for U.S. Attorneys, Administrative Office of the U.S. Courts, U.S. Sentencing Commission, and Federal Bureau of Prisons.

From fiscal year (FY) 2015 to FY 2016, federal arrests decreased by 1%, from 153,478 arrests to 151,460. The number of defendants sentenced to federal prison decreased by 3%, from 56,018 in FY 2015 to 54,274 in FY 2016. Of the nearly 380,000 persons under federal correctional control on September 30, 2016 (fiscal year-end), 59% were in secure confinement and 41% were under community supervision. This represents a decrease from fiscal year-end 2015, when 392,212 persons were under federal correctional control (60% in secure confinement and 40% on supervision in the community).

HIGHLIGHTS

  • A total of 151,460 arrests were made by federal law enforcement agencies in fiscal year (FY) 2016.
  • More than half (58%) of all federal arrests in FY 2016 took place in the five federal judicial districts along the U.S.-Mexico border, up from 45% in FY 2006.
  • In FY 2016, the five federal judicial districts along the U.S.-Mexico border accounted for 52% of all suspects investigated and 41% of all offenders who were sentenced to federal prison.
  • Forty-five percent of federal arrests in FY 2016 involved an immigration offense as the most serious arrest offense.
  • In FY 2016, 41% of defendants charged in all U.S. district courts were not U.S. citizens: 30% were Mexican citizens, 5% were from Central America, and 6% were citizens of other foreign nations.
  • In FY 2016, 59% of defendants charged in U.S. district courts were U.S. citizens, 5% were legal aliens, and 36% were illegal aliens.
  • From FY 2006 to FY 2016, Drug Enforcement Administration arrests for heroin or other opioids increased 154%.


Fiscal 50: State Trends and Analysis

In ninth year of recovery, states’ fiscal and economic prospects perked up

After years of slow progress, states benefited from a more promising economic and fiscal environment in 2018. Pressure on state finances eased somewhat as the second-longest economic recovery gained momentum and state tax revenue jumped, at least temporarily. Still, not all states have fully recovered from the shocks of the Great Recession more than a decade ago. Some are in a stronger position than others as they gauge how long the recovery will last.

A surge in tax receipts provided budget relief for many states, though some of the extra money was due to short-lived effects from the federal Tax Cuts and Jobs Act. Tax collections in 41 states—the most yet—had surpassed their recession-era peaks by late 2018, after adjusting for inflation. The extra revenue led a number of states to add to their rainy day funds, which could cover a bigger share of spending than before the recession in at least half the states.

Economically, employment rates and growth are on the upswing. Still, the estimated share of prime working-age adults with jobs was lower than before the recession in most states at the end of 2017, and growth measured by state personal income still lagged historic rates.

  • Tax revenue. The strongest stretch of tax revenue growth in seven years extended into the third quarter of 2018, but at least some of the gains were temporary and are expected to fade in upcoming quarters. Overall, just nine states took in less tax revenue than before receipts plunged in the downturn, after accounting for inflation. State by state, the recovery has been uneven because of differences in economic conditions and tax policy choices. States with below-peak tax revenue still have less purchasing power than a decade earlier.
  • Reserves and balances. States had more savings set aside at the end of fiscal 2018 to weather the next economic downturn than at any point since the 2007-09 recession. Nationwide, rainy day funds held a record amount of money, and at least 26 states’ savings exceeded pre-recession levels when measured as a share of operating costs. A tax revenue surge in fiscal 2018 helped 32 states expand their rainy day funds. Still, just over half of states were less financially equipped, counting rainy day funds plus leftover general fund dollars, to cover their costs than just before the recession.
  • Employment-to-population ratio. The U.S. employment rate for adults of prime working age rose in 2017 for a seventh consecutive year, though no state could boast that its core labor pool had clearly surpassed its pre-recession employment rate. The share of prime-working-age adults (ages 25 to 54) with a job clearly remained below pre-recession levels nationally and in 10 states. Employment rates for this population were lower than in 2007 in another 30 states and higher in 10, but not by statistically significant amounts, so the results were inconclusive.
  • State personal income. The second-longest U.S. economic recovery has played out unevenly across states. Growth has been strongest in North Dakota and a group of Western and Southern states and weakest in Connecticut and Mississippi, as measured by the rate of change in each state’s total personal income since the start of the Great Recession. State personal income growth—a measure of the economy—has trailed its historical pace. But in a sign of underlying economic strength, gains were widespread among states in the fourth quarter of 2018 from a year earlier.
     

Global Prison Trends 2018

Global Prison Trends 2018 is the fourth edition in Penal Reform International’s annual series, published in collaboration with the Thailand Institute of Justice. The report analyses trends in criminal justice and the use of imprisonment and, as in previous years, these show that while overall crime rates around the world have declined, the number of people in prison on any given day is rising. 

Gross Domestic Product by State: Fourth Quarter and Annual 2018

Annual GDP by state in 2018

Real GDP increased in 49 states and the District of Columbia in 2018. The percent change in real GDP ranged from 5.7 percent in Washington to -0.3 percent in Alaska. Information services; professional, scientific, and technical services; and durable goods manufacturing were the leading contributors to national economic growth in 2018. Information services and retail trade were the leading contributors to the increase in real GDP in Washington, the fastest growing state.


Other highlights

  • In addition to Washington, information services was the leading contributor to the increase in real GDP in four additional states, including California.
  • Professional, scientific, and technical services was the leading contributor to the increase in real GDP in Utah, the second fastest growing state.
  • Durable goods manufacturing was the leading contributor to the increase in real GDP in Idaho, the third fastest growing state.

Jail Inmates in 2017

County and city jails in the United States reported a total confned population of 745,200 inmates at midyear 2017. About 65% (482,000) of the confned inmates were awaiting court action on a current charge. The remaining 35% (263,200) were sentenced or convicted ofenders awaiting sentencing. The jail incarceration rate at midyear 2017 was 229 inmates per 100,000 U.S. residents, down from 259 per 100,000 at midyear 2007 and 237 per 100,000 at midyear 2012.

Findings in this report are based on the Annual Survey of Jails (ASJ), a nationally representative survey of county or city jail jurisdictions and regional jails in the country. Since 1982, the Bureau of Justice Statistics (BJS) has conducted the ASJ to track changes in the number and characteristics of local jail inmates nationwide, jail inmate turnover, jail capacity, and space usage by other authorities. 

HIGHLIGHTS

  • County and city jails held 745,200 inmates at midyear 2017, down from 780,200 at midyear 2007.
  • The jail incarceration rate declined from 259 inmates per 100,000 U.S. residents at midyear 2007 to 229 per 100,000 at midyear 2017, a 12% decrease.
  • In 2017, males were incarcerated in jail at a rate (394 per 100,000 male U.S. residents) 5.7 times that of females (69 per 100,000 female U.S. residents).
  • In 2017, jails reported 10.6 million admissions, a 19% decline from 2007.
  • The estimated average time in jail in 2017 was 26 days.
  • The total rated capacity of county and city jails was 915,100 beds at midyear 2017.
  • An estimated 81% of jail beds were occupied in 2017, down from 95% in 2005.
  • From 2005 to 2017, the jail incarceration rate for whites increased 12%, while the rate for blacks decreased 23%.
  • The male incarceration rate dropped from 448 per 100,000 male residents in 2005 to 394 per 100,000 in 2017, a 12% drop.
  • Jails employed 225,700 full-time staf at midyear 2017, and the inmate-to-correctional-ofcer ratio was 4.2 to 1. 

Local Government Technology: Across America

Technology is transforming both the business and leadership of state and local government. Whether it’s service delivery, empowering employees or interacting with the public, infusing what the public sector does with technological innovation is now an expectation. Route Fifty hit the road to meet with the innovators and technologists leading this change and to discuss some of the biggest themes in government technology. In this eBook, Route Fiftly looks at case studies and best practices from states, counties, and cities leading the way while also exploring what the power of technology could mean for the future of state and local governments.

Mass Incarceration: The Whole Pie 2018

Can it really be true that most people in jail are being held before trial? And how much of mass incarceration is a result of the war on drugs? These questions are harder to answer than you might think, because our country’s systems of confinement are so fragmented. The various government agencies involved in the justice system collect a lot of critical data, but it is not designed to help policymakers or the public understand what’s going on. Meaningful criminal justice reform that reduces the massive scale of incarceration, however, requires that we start with the big picture.

This report offers some much needed clarity by piecing together this country’s disparate systems of confinement. The American criminal justice system holds almost 2.3 million people in 1,719 state prisons, 102 federal prisons, 1,852 juvenile correctional facilities, 3,163 local jails, and 80 Indian Country jails as well as in military prisons, immigration detention facilities, civil commitment centers, state psychiatric hospitals, and prisons in the U.S. territories. And we go deeper to provide further detail on why people are locked up in all of those different types of facilities.

Occupational Employment and Wages, May 2018: Correctional Officers and Jailers


Guard inmates in penal or rehabilitative institutions in accordance with established regulations and procedures. May guard prisoners in transit between jail, courtroom, prison, or other point. Includes deputy sheriffs and police who spend the majority of their time guarding prisoners in correctional institutions.


Older Americans' Use of Facebook Up From 2011

WASHINGTON, D.C. -- Facebook has consistently been most popular with younger adults aged 18 to 29, but the percentage of this group who use it -- currently 72% -- has not changed significantly since Gallup last measured it in 2011. Meanwhile, each older age group has shown significant growth in Facebook use since that time.

The greatest increase in Facebook use from 2011 to 2018 has been among adults aged 50 to 64. This group's rate of use has grown from about a third in 2011 to more than half today. Retirement-age adults have nearly doubled their rate of use.

Use of the social media platform has increased less among adults aged 30 to 49, by nine percentage points, to the current 65%.

Young adults are still the age group most likely to be on Facebook, but the gaps have narrowed considerably since 2011, with 30- to 49-year-olds reporting nearly as much use as those under age 30.

Prisoners in 2017

The United States prison population declined from 1,508,129 at the end of 2016 to 1,489,363 at the end of 2017, a decrease of 1.2%. During the same period, the number of prisoners under the jurisdiction of federal correctional authorities decreased by 6,100 (down 3%), and the number of prisoners under the jurisdiction of state correctional authorities fell by 12,600 (down 1%). The imprisonment rate for sentenced prisoners was the lowest since 1997, at 440 prisoners per 100,000 U.S. residents of all ages and 568 per 100,000 U.S. residents age 18 or older. (Counts of sentenced prisoners include those who have received a sentence of more than one year.)

Findings in this report are based on the National Prisoner Statistics (NPS) program, administered by the Bureau of Justice Statistics (BJS). The program collects annual data from state departments of corrections (DOCs) and the Federal Bureau of Prisons (BOP) on prison capacity and prisoner counts, characteristics, admissions, and releases. This report is the ninety-second in a series that began in 1926. Forty-eight states and the BOP reported NPS data for 2017, while data for New Mexico and North Dakota were obtained from other sources or were imputed (see Methodology).

HIGHLIGHTS

  • The imprisonment rate for sentenced prisoners under state or federal jurisdiction decreased 2.1% from 2016 to 2017 (from 450 to 440 sentenced prisoners per 100,000 U.S. residents) and 13% from 2007 to 2017 (from 506 to 440 per 100,000).
  • The number of prisoners under state or federal jurisdiction decreased by 18,700 (down 1.2%), from 1,508,100 at year-end 2016 to 1,489,400 at year-end 2017.
  • The federal prison population decreased by 6,100 prisoners from year-end 2016 to year-end 2017 (down 3%), accounting for one-third of the overall change in the U.S. prison population.
  • More than half (55%) of state prisoners were serving sentences for violent ofenses at year-end 2016, the most recent year for which data are available.
  • The number of state or federal prisoners held in private facilities decreased 5% from 2016 to 2017.
  • Non-citizens made up roughly the same portion of the U.S. prison population (7.6%) as of the total U.S. population (7.0%, per the U.S. Census Bureau).
  • The imprisonment rate of sentenced black adults declined by 4% from 2016 to 2017 and by 31% from 2007 to 2017.
  • Nearly half of federal prisoners were serving a sentence for a drug-trafcking ofense at fscal year-end 2017.
  • At year-end 2017, the imprisonment rate for sentenced black males (2,336 per 100,000 black male U.S. residents) was almost six times that of sentenced white males (397 per 100,000 white male U.S. residents).
  • At year-end 2016, an estimated 60% of Hispanics and blacks sentenced to serve more than one year in state prison had been convicted of and sentenced for a violent ofense, compared to 48% of white prisoners.

Probation and Parole in the United States, 2016

An estimated 4,537,100 adults were under community supervision as of December 31, 2016 (year-end), a decline of 1.1% from 4,586,900 on January 1, 2016. An estimated one in 55 adults in the United States were under community supervision at year-end 2016. Persons on probation accounted for the majority (81%) of adults under community supervision.

The decline observed in the adult community corrections population in 2016 was the result of a decrease in the probation population. The probation population declined 1.4%, from an estimated 3,725,600 offenders on January 1, 2016, to 3,673,100 at year-end 2016. The parole population continued to grow, increasing by 0.5%, from 870,500 persons at year-end 2015 to 874,800 at year-end 2016.

HIGHLIGHTS

  • At year-end 2016, an estimated 4,537,100 adults were under community supervision (probation or parole), down 49,800 offenders (down 1.1%) from January 1, 2016.
  • The total community supervision population in 2016 was at its lowest level since 1999.
  • Approximately 1 in 55 adults in the United States were under community supervision at year-end 2016.
  • The adult probation population declined by 1.4% from January 1, 2016, to December 1, 2016, falling by 52,500 (to 3,673,100).
  • Probation exits increased from 2,043,200 in 2015 to 2,071,400 in 2016.
  • The adult parole population increased by 0.5% (up 4,300) from year-end 2015 to an estimated 874,800 at year-end 2016.
  • Exits from parole decreased from an estimated 463,700 in 2015 to 456,000 in 2016. 

Public Attitudes Toward Computer Algorithms

Algorithms are all around us, utilizing massive stores of data and complex analytics to make decisions with often significant impacts on humans. They recommend books and movies for us to read and watch, surface news stories they think we might find relevant, estimate the likelihood that a tumor is cancerous and predict whether someone might be a criminal or a worthwhile credit risk. But despite the growing presence of algorithms in many aspects of daily life, a Pew Research Center survey of U.S. adults finds that the public is frequently skeptical of these tools when used in various real-life situations.

This skepticism spans several dimensions. At a broad level, 58% of Americans feel that computer programs will always reflect some level of human bias – although 40% think these programs can be designed in a way that is bias-free. And in various contexts, the public worries that these tools might violate privacy, fail to capture the nuance of complex situations, or simply put the people they are evaluating in an unfair situation. Public perceptions of algorithmic decision-making are also often highly contextual. The survey shows that otherwise similar technologies can be viewed with support or suspicion depending on the circumstances or on the tasks they are assigned to do.

Quick Facts - United States

QuickFacts provides statistics for all states and counties, and for cities and towns with a population of 5,000 or more.

About datasets used in this table

Value Notes

Estimates are not comparable to other geographic levels due to methodology differences that may exist between different data sources.

Some estimates presented here come from sample data, and thus have sampling errors that may render some apparent differences between geographies statistically indistinguishable. Click the Quick Info icon to the left of each row in TABLE view to learn about sampling error.

The vintage year (e.g., V2018) refers to the final year of the series (2010 thru 2018). Different vintage years of estimates are not comparable.

Fact Notes

  • (a)Includes persons reporting only one race
  • (b)Hispanics may be of any race, so also are included in applicable race categories
  • (c)Economic Census - Puerto Rico data are not comparable to U.S. Economic Census data

Value Flags

  • -Either no or too few sample observations were available to compute an estimate, or a ratio of medians cannot be calculated because one or both of the median estimates falls in the lowest or upper interval of an open ended distribution.
  • DSuppressed to avoid disclosure of confidential information
  • FFewer than 25 firms
  • FNFootnote on this item in place of data
  • NANot available
  • SSuppressed; does not meet publication standards
  • XNot applicable
  • ZValue greater than zero but less than half unit of measure shown

QuickFacts data are derived from: Population Estimates, American Community Survey, Census of Population and Housing, Current Population Survey, Small Area Health Insurance Estimates, Small Area Income and Poverty Estimates, State and County Housing Unit Estimates, County Business Patterns, Nonemployer Statistics, Economic Census, Survey of Business Owners, Building Permits.

State Minimum Wages | 2018 Highlights

Eighteen states began the new year with higher minimum wages. Eight states (Alaska, Florida, Minnesota, Missouri, Montana, New Jersey, Ohio and South Dakota) automatically increased their rates based on the cost of living, while eleven states (Arizona, California, Colorado, Hawaii, Maine, Michigan, New York, Rhode Island, Vermont and Washington) increased their rates due to previously approved legislation or ballot initiatives.  

Massachusetts enacted a measure (HB 4640) to increase the state minimum wage to $15 over five years. The tipped wage would rise to $6.75 from $3.75 over the same time period.

Delaware enacted SB 170, which phases in a two-step increase. The rate rises from $8.25 to $8.75 effective Jan. 1, 2019 (as amended by HB 483), and will increase again to $9.25 effective Oct. 1, 2019. 

Voters in Arkansas and Missouri approved ballot initiatives phasing in increases to $11 and $12 per hour, respectively. 

The Michigan legislature enacted SB 1171, which raises the minimum wage on an annual basis until it reaches $12.05 in 2030.

State of the Global Workplace

Almost a decade after the onset of the Great Recession, the world economy continues to struggle. The global gross domestic product has puttered along at under 3% growth since 2012, well below historical norms. Widespread joblessness — particularly among young people — has led to social and political strife in many areas. Since 2015, economic frustrations have likely contributed to a rise in nationalism and growing resentment toward immigrants, particularly in the U.S. and Europe.

The resulting social and political volatility is not just a government issue. These conditions dampen business development as skittish investors weigh increased risk. To achieve productivity gains while avoiding the instability that disrupts sustainable growth, governments and businesses alike need to place new focus on the resources and strategies they use to develop and empower their citizens and workforces. Broad-based strategies for human capital development give more individuals a stake in the success of their employer or their country, boosting their motivation and reducing the potential for conflict.

 For governments, the goal is to expand the availability of high-quality jobs and the number of residents qualified to take them. Gallup’s global surveys from 2014 to 2016 indicate that 32% of working-age adults across 155 countries are employed full time for an employer — an important measure of the availability of good jobs.

However, Gallup’s workplace analytics identify immense room for productivity gains among those employees. Worldwide, the percentage of adults who work full time for an employer and are engaged at work — they  are highly involved in and enthusiastic about their work and workplace — is just 15%. That low percentage of engaged employees is a barrier to creating high-performing cultures. It implies a stunning amount of wasted potential, given that business units in the top quartile of our global employee engagement database are 17% more productive and 21% more profitable than those in the bottom quartile.

Why is the global proportion of employees who are engaged in their work so low? There are many potential reasons — but resistance to change is a common underlying theme in Gallup’s research and experience. In particular, organizations and institutions have often been slow to adapt to the rapid changes produced by the spread of information technology, the globalization of markets for products and labor, the rise of the gig economy, and younger workers’ unique expectations. Business and political leaders must recognize when traditional patterns in management practices, education or gender roles, for example, become roadblocks to workers’ motivation and productivity, and when selectively disrupting tradition will help clear a path to greater prosperity and transformed company cultures.

The 2018 Long-Term Budget Outlook

At a Glance

Each year, the Congressional Budget Office issues a set of long-term budget projections—that is, projections of what federal spending, revenues, deficits, and debt would be for the next 30 years if current laws generally did not change. This report is the latest in the series.

  • In CBO’s projections, the federal budget deficit, relative to the size of the economy, grows substantially over the next several years, stabilizes for a few years, and then grows again over the rest of the 30-year period, leading to federal debt held by the public that would approach 100 percent of gross domestic product (GDP) by the end of the next decade and 152 percent by 2048. Moreover, if lawmakers changed current laws to maintain certain policies now in place—preventing a significant increase in individual income taxes in 2026, for example—the result would be even larger increases in debt.
  • The federal government’s net interest costs are projected to climb sharply as interest rates rise from their currently low levels and as debt accumulates. Such spending would about equal spending for Social Security, currently the largest federal program, by the end of the projection period.
  • Noninterest spending is projected to rise from 19 percent of GDP in 2018 to 23 percent in 2048, mainly because of increases in spending for Social Security and the major health care programs (primarily Medicare). Much of the spending growth for Social Security and Medicare results from the aging of the population. Growth in spending for Medicare and the other major health care programs is also driven by rising health care costs per person.
  • Revenues, in contrast, are projected to be roughly flat over the next few years relative to GDP, rise slowly, and then jump in 2026. Thereafter, revenues would continue to rise relative to the size of the economy—although they would not keep pace with growth in spending. The projected growth in revenues is largely attributable to increases in individual income tax receipts.
  • Compared with last year’s projections, debt as a percentage of GDP is larger, but only modestly so, through 2041 and then lower thereafter. Deficits are higher as a percentage of GDP through 2025 and lower thereafter. That change is largely driven by changes in revenues and net interest costs. Revenues are initially lower as a share of GDP, but ultimately are higher because individual income taxes are now projected to grow more quickly as a result of provisions of Public Law 115-97 (originally called the Tax Cuts and Jobs Act and called the 2017 tax act in this report).

The Employment Situation - October 2018

Total nonfarm payroll employment rose by 250,000 in October, and the unemployment rate was unchanged at 3.7 percent, the U.S. Bureau of Labor Statistics reported today. Job gains occurred in health care, in manufacturing, in construction, and in transportation and warehousing. 

The unemployment rate remained at 3.7 percent in October, and the number of unemployed persons was little changed at 6.1 million. Over the year, the unemployment rate and the number of unemployed persons declined by 0.4 percentage point and 449,000, respectively. (See table A-1.) 

Among the major worker groups, the unemployment rates for adult men (3.5 percent), adult women (3.4 percent), teenagers (11.9 percent), Whites (3.3 percent), Blacks (6.2 percent), Asians (3.2 percent), and Hispanics (4.4 percent) showed little or no change in October. (See tables A-1, A-2, and A-3.) 

The number of long-term unemployed (those jobless for 27 weeks or more) was essentially unchanged at 1.4 million in October and accounted for 22.5 percent of the unemployed. (See table A-12.) 

The labor force participation rate increased by 0.2 percentage point to 62.9 percent in October but has shown little change over the year. The employment-population ratio edged up by 0.2 percentage point to 60.6 percent in October and has increased by 0.4 percentage point over the year. (See table A-1.) 

The number of persons employed part time for economic reasons (sometimes referred to as involuntary part-time workers) was essentially unchanged at 4.6 million in October. These individuals, who would have preferred full-time employment, were working part time because their hours had been reduced or they were unable to find full-time jobs. (See table A-8.) 

In October, 1.5 million persons were marginally attached to the labor force, little changed from a year earlier. (Data are not seasonally adjusted.) These individuals were not in the labor force, wanted and were available for work, and had looked for a job sometime in the prior 12 months. They were not counted as unemployed because they had not searched for work in the 4 weeks preceding the survey. (See table A-16.) 

Among the marginally attached, there were 506,000 discouraged workers in October, about unchanged from a year earlier. (Data are not seasonally adjusted.) Discouraged workers are persons not currently looking for work because they believe no jobs are available for them. The remaining 984,000 persons marginally attached to the labor force in October had not searched for work for reasons such as school attendance or family responsibilities. (See table A-16.) 

The Evolving Landscape of Crime and Incarceration

Doubts about the current system of mass incarceration emerge in a nationally representative survey, even in more politically conservative, rural parts of the country. Indeed, in an era of broad speculation about a growing urban-rural divide, there is general consensus between rural America, small cities and major metropolitan areas that the criminal justice system is not working and communities should focus on priorities other than spending millions on prisons and jails.

A 40 percent plurality believe incarceration rates in their communities are too high, and a 66 percent majority would describe themselves as “concerned” if they learned incarceration rates in their community were higher than in similar communities. In rural communities, a 60 percent majority would be concerned. 

The Future of Jobs Report 2018

Key Findings

As technological breakthroughs rapidly shift the frontier between the work tasks performed by humans and those performed by machines and algorithms, global labor markets are undergoing major transformations. These transformations, if managed wisely, could lead to a new age of good work, good jobs and improved quality of life for all, but if managed poorly, pose the risk of widening skills gaps, greater inequality and broader polarization.

As the Fourth Industrial Revolution unfolds, companies are seeking to harness new and emerging technologies to reach higher levels of efficiency of production and consumption, expand into new markets, and compete on new products for a global consumer base composed increasingly of digital natives. Yet in order to harness the transformative potential of the Fourth Industrial Revolution, business leaders across all industries and regions will increasingly be called upon to formulate a comprehensive workforce strategy ready to meet the challenges of this new era of accelerating change and innovation.

This report finds that as workforce transformations accelerate, the window of opportunity for proactive management of this change is closing fast and business, government and workers must proactively plan and implement a new vision for the global labour market. The report’s key findings include:

  • Drivers of change: Four specific technological advances—ubiquitous high-speed mobile internet; artificial intelligence; widespread adoption of big data analytics; and cloud technology—are set to dominate the 2018–2022 period as drivers positively affecting business growth. They are flanked by a range of socio-economic trends driving business opportunities in tandem with the spread of new technologies, such as national economic growth trajectories; expansion of education and the middle classes, in particular in developing economies; and the move towards a greener global economy through advances in new energy technologies.
  • Accelerated technology adoption: By 2022, according to the stated investment intentions of companies surveyed for this report, 85% of respondents are likely or very likely to have expanded their adoption of user and entity big data analytics. Similarly, large proportions of companies are likely or very likely to have expanded their adoption of technologies such as the internet of things and app- and web-enabled markets, and to make extensive use of cloud computing. Machine learning and augmented and virtual reality are poised to likewise receive considerable business investment.
  • Trends in robotization: While estimated use cases for humanoid robots appear to remain somewhat more limited over the 2018–2022 period under consideration in this report, collectively, a broader range of recent robotics technologies at or near commercialization—including stationary robots, non-humanoid land robots and fully automated aerial drones, in addition to machine learning algorithms and artificial intelligence—are attracting significant business interest in adoption. Robot adoption rates diverge significantly across sectors, with 37% to 23% of companies planning this investment, depending on industry. Companies across all sectors are most likely to adopt the use of stationary robots, in contrast to humanoid, aerial or underwater robots, however leaders in the Oil & Gas industry report the same level of demand for stationary and aerial and underwater robots, while employers in the Financial Services industry are most likely to signal the planned adoption of humanoid robots in the period up to 2022.

The Use of Technology in the Clinical Care of Depression: An Evidence Map

Abstract

Objective: Depression is a highly prevalent clinical condition. The use of technologies in the clinical care of depressive disorders may increase the reach of clinical services for these disorders and support more comprehensive treatment. The objective of this evidence map is to provide an overview of the use of technology in the clinical care of depression.

Data Sources: The authors searched PubMed, PsycINFO, and the Web of Science from inception to June 2017 to identify published randomized controlled trials (RCTs).

Study Selection: Two reviewers used predetermined eligibility criteria to review 4,062 records and include 161 RCTs that met our inclusion criteria. We include studies evaluating any type of treatment-related technology in the clinical care of depression.

Data Extraction: We extracted data on sample sizes, the type of technology examined, the function of that technology, the effectiveness of the technology, and publication year.

Results: Out of 161 RCTs, we found the greatest amount of research for psychotherapy by computer (51 RCTs). The majority of studies were published after 2012 (94 RCTs; 58%). Few published studies involved videoconferences or smartphones, or provider feedback or auto-reminders. 145 studies (90%) reported that the intervention had a positive outcome of symptom improvement compared to baseline.

Conclusions: This evidence map provides a broad overview of the existing research evaluating technology in depression care. Computer applications are still most common. Almost all applications yield symptom improvement. More information is needed to evaluate the role of technology in clinical care.

The world's biggest economies in 2018

The United States has the largest economy in the world at $20.4 trillion, according to data from the International Monetary Fund (IMF), which shows the US economy increased from around $19.4 trillion last year.

China follows, with $14 trillion, which is an increase of more than $2 trillion in comparison to 2017. Japan is in third place with an economy of $5.1 trillion, up from $4.87 trillion a year previously.

European countries round off the top 5.

Three European countries take up the next places on the list: Germany is fourth, with a $4.2 trillion economy, the United Kingdom is fifth with $2.94 trillion and France is sixth with $2.93 trillion.

Close behind the UK and France, in seventh, India’s economy is $2.85 trillion, and Italy is in eighth with an economy of $2.18 trillion. Ninth on the list is Brazil, with an economy of more than $2.14 trillion, while Canada is 10th with a $1.8 trillion economy.

The sheer scale of the United States’ economy puts others into perspective. It is larger than the combined economies of numbers four to 10 on the list above. Overall, the global economy is worth an estimated $79.98 trillion, meaning the US accounts for more than one-quarter of the world total.

U.S. and World Population Clock (2019)

About the Population Clock and Population Estimates

U.S. Population

The U.S. population clock is based on a series of short-term projections for the resident population of the United States. This includes people whose usual residence is in the 50 states and the District of Columbia. These projections do not include members of the Armed Forces overseas, their dependents, or other U.S. citizens residing outside the United States.

The projections are based on a monthly series of population estimates starting with the April 1, 2010 resident population from the 2010 Census.

At the end of each year, a new series of population estimates, from the census date forward, is used to revise the postcensal estimates, including the population clock projections series. Once a series of monthly projections is completed, the daily population clock numbers are derived by interpolation. Within each calendar month, the daily numerical population change is assumed to be constant, subject to negligible differences caused by rounding.

Population estimates produced by the U.S. Census Bureau for the United States, states, counties, and cities or towns can be found on the Population Estimates web page. Future projections for the United States can be found on the Population Projections web page.

Women’s Mass Incarceration: The Whole Pie 2018

With growing public attention to the problem of mass incarceration, people want to know about women’s experience with incarceration. How many women are held in prisons, jails, and other correctional facilities in the United States? And why are they there? How is their experience different from men’s? While these are important questions, finding those answers requires not only disentangling the country’s decentralized and overlapping criminal justice systems, but also unearthing the frustratingly hard to find and often altogether missing data on gender.

This report provides a detailed view of the 219,000 women incarcerated in the United States, and how they fit into the even broader picture of correctional control. This 2018 update to our inaugural Women’s Whole Pie report pulls together data from a number of government agencies and calculates the breakdown of women held by each correctional system by specific offense. The report, produced in collaboration with the ACLU’s Campaign for Smart Justice, answers the questions of why and where women are locked up...

World crime trends and emerging issues and responses in the field of crime prevention and criminal justice

The present document was prepared in accordance with the practice established pursuant to Economic and Social Council resolution 1990/18.

Crime prevention is often interpreted narrowly, focusing on techniques to resolve local crime problems. But what can be learned from broader crime trends, where national or international issues are at stake? The present report contains a brief overview of some of the most dramatic shifts in crime trends, and asks what these examples might imply about the role of the criminal justice system, and crime policy generally. Can targeted interventions really make a difference on a national or international scale?

The report contains an overview of some large-scale, dramatic reductions in different crimes and how they came about. It asks what can be learned from those crime prevention success stories. Taking advantage of the fact that the United Nations Survey of Crime Trends and Operations of Criminal Justice Systems captures both crime and criminal justice data for a large number of countries, the present report also contains an overview of striking regional reductions in homicide and of the issue of whether trends in the national criminal justice responses of the regions had any impact.

World Economic Situation and Prospects 2018

The world economy has strengthened as lingering fragilities related to the global financial crisis subside. In 2017, global economic growth reached 3%—the highest growth rate since 2011—and growth is expected to remain steady for the coming year.  The improved global economic situation provides an opportunity for countries to focus policy towards longer-term issues such as low carbon economic growth, reducing inequalities, economic diversification and eliminating deep-rooted barriers that hinder development.

However, the recent improvements in growth remain unevenly distributed across countries and regions. Economic prospects for many commodity exporters remain particularly challenging. Negligible growth in per capita GDP is anticipated in several parts of Africa, Western Asia, and Latin America and the Caribbean. The impacted regions combined are home to 275 million people living in extreme poverty. Without sustained, economic growth, the chances of bringing that number to zero remain slim. To achieve the goals of eradicating poverty and creating decent jobs for all, it is essential to address the longer‑term structural issues that hold back a faster progress towards sustainable development.